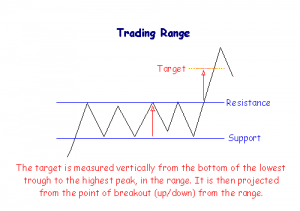
Trading Ranges
Trading ranges are also referred to as:
- Ranging markets;
- lines in Dow Theory; or
- rectangles in short-term patterns.
Bounded by support and resistance lines in close proximity, trading ranges signal distribution when they occur in an up-trend and accumulation in a down-trend. Price fluctuates within a narrow band, of 5% to 10%, with no clear trend.
Breakouts from a range can occur in either direction. A target for the move can be calculated by measuring the height of the trading range and projecting this upwards from the point of breakout (or downwards if there is a downside breakout).
Volume Confirmation
Analysts often study the behavior of volume for clues as to the likely direction of a breakout. Volume should contract during the formation of the trading range and then expand on the breakout above or below the range. While the market is ranging, increased volume at peaks suggests an upward breakout, increased volume at troughs indicates a downside breakout.
Trading Signals
Breakouts are stronger signals when confirmed by volume.
Go long at a breakout above the trading range.
Place a stop-loss one tick below the bottom of the trading range.
There is frequently a correction back to the resistance level at the upper border of the trading range, which then acts as a support level. Go long on a reversal signal and place a stop-loss one tick below the support level.
Go short at a breakout below the trading range.
Place a stop-loss just above the upper border of the trading range.
Price often rallies back to the support level at the lower edge of the trading range. The support level then acts as a resistance level. Go short on a reversal signal and place a stop-loss above the resistance level.

Hi everyone ,How 2 get web traffic 2 my {site |website |blog |weblog |site blog? gracias