
The past decade witnessed a new type of trading strategy surface that has become widely popular with forex traders.
The energy behind supply and demand zones is well documented. The problem, however, is many traders fail to recognise the subtle nuances that help determine an area’s strength.
The basics
In a nutshell, supply and demand is an approach based on technical analysis, specifically price action. Traders search for robust areas that form a healthy advance or decline.
A demand zone forms by way of a notable rally north; it’s the same for a supply area, though through a move to the downside.
Four key areas of interest exist on the charts:
- The rally base rally, or ‘RBR’.
- The drop base drop, or ‘DBD’.
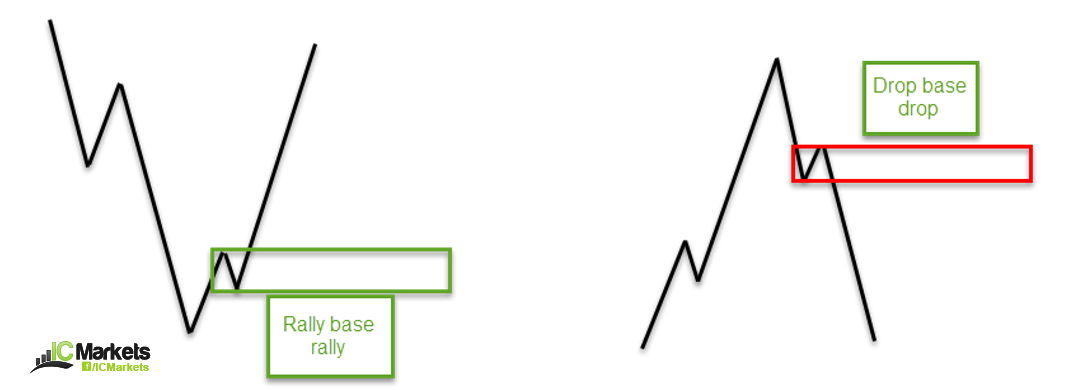
(FIGURE 1.1)
- The drop base rally, or ‘DBR’.
- The rally base drop, or ‘RBD’.
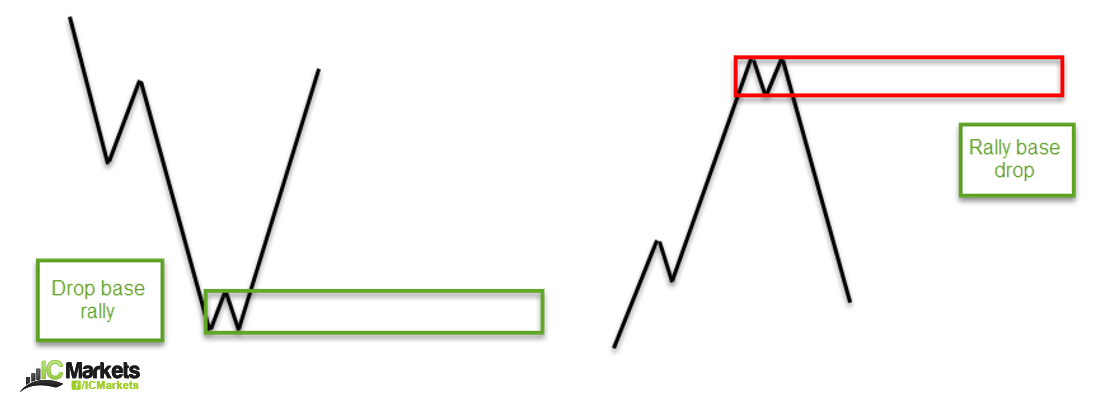
(FIGURE 1.2)
- A ‘RBR’ demand zone generally forms in an uptrend, though can also be seen at the beginning of trends. Figure 1.1 shows price movement begins with an advance, transitions into a consolidation phase (the base), and follows with a continuation move to the upside. These areas are effective at bouncing price, particularly on the first time back.
- A ‘DBD’ supply zone is the same formation as a ‘RBR’ area, but forms within a downtrend, or at the beginning of trends. Referring to figure 1.1, price begins its decline, enters a consolidation and eventually follows through with a continuation to the downside.
- A ‘DBR’ demand is a zone normally denoting a bottom. In figure 1.2, price initially trends south, forming lower lows and lower highs until the instrument begins to bottom (or base). A reversal follows to the upside, creating the zone, which is tradable upon return, especially on the first time back.
- A ‘RBD’ supply forms in the same manner as the ‘DBR’ pattern (see figure 1.2). The only difference is instead of a market bottom, the pattern prints a market top and follows through with a move lower.
Figure 1.3 illustrates the noted zones in chart form. Not all areas give winning trades. This is part of trading. Learning how to accept a loss is a large part of the business.
Traders typically fix entry orders at the upper edge of the base for demand and at the lower boundary for supply zones. Stop-loss orders (risk management) are found best positioned at the opposite edge of the area, while take-profit targets are generally set at areas of supply and demand in the opposite direction.
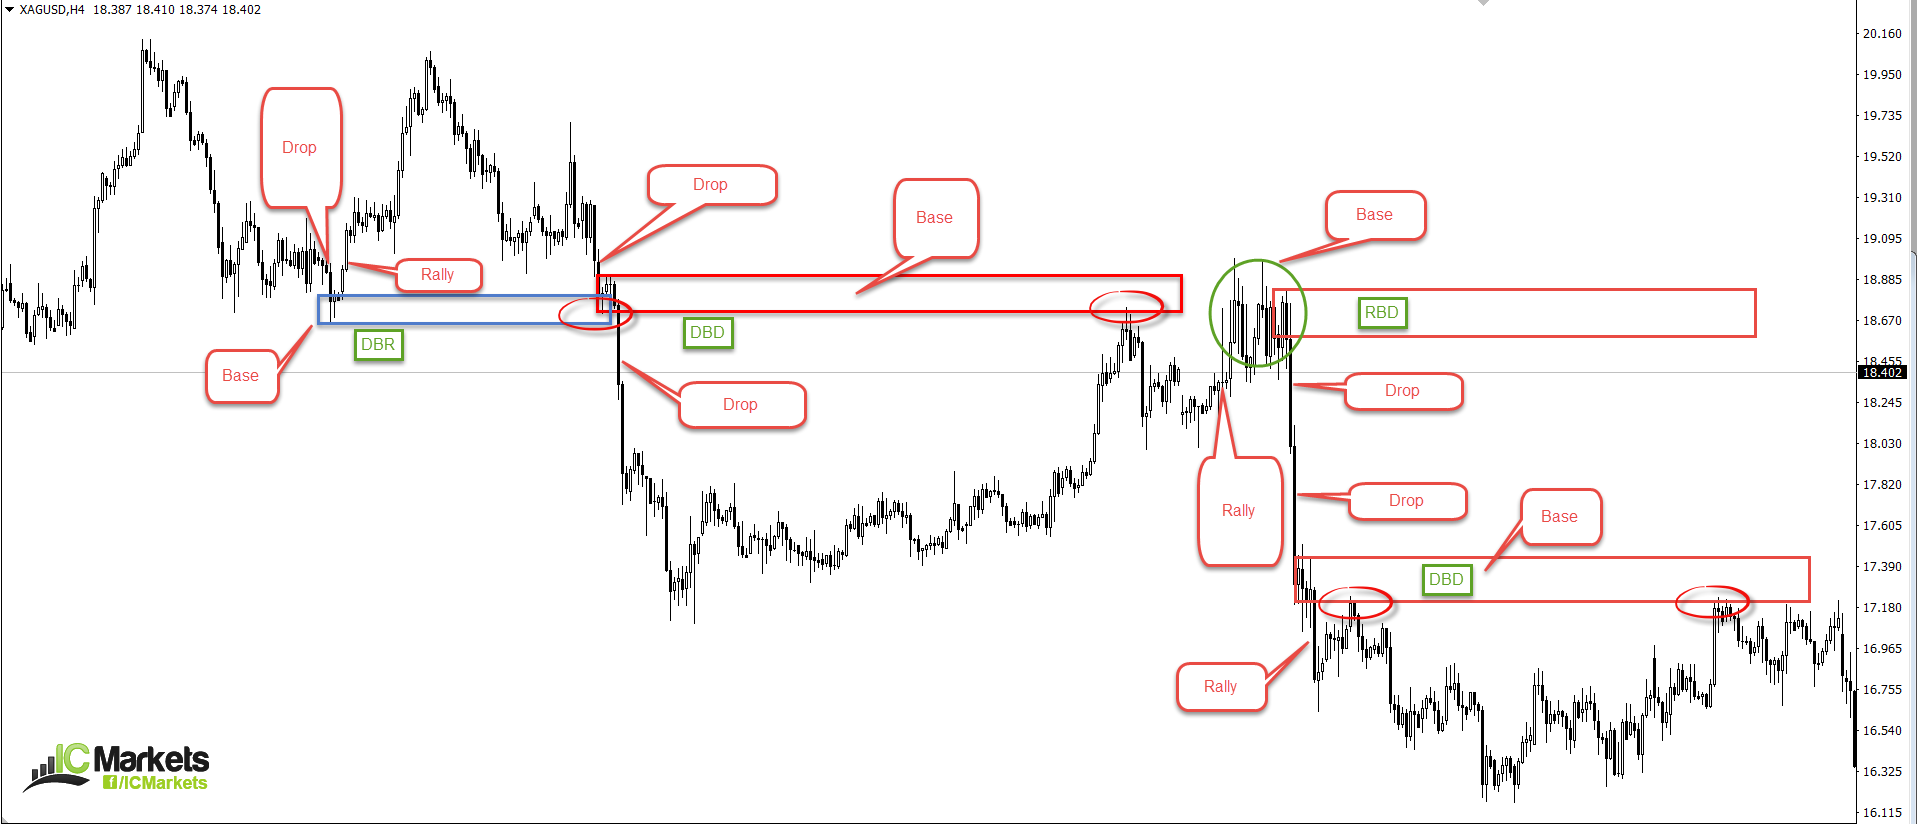
(FIGURE 1.3)
Difference between supply and demand and support and resistance
Debate among technicians as to whether any difference exists between supply and demand or support and resistance continues to haunt trading forums. It remains a somewhat subjective subject.
According to research, support and resistance is a line (though usually defined as an area to avoid whipsaws) that’s noticeably held price in history, and, therefore, may do so again in the future. Supply and demand, however, involves a noticeable recent move and a fresh untouched base. It’s this base that interests traders.
Momentum
Supply and demand areas boasting healthy momentum, engulfing nearby highs/lows, are desirable. It is essentially points on the chart showing price was able to move with little opposition.
In fact, healthy momentum out of the base should be a requirement as it informs traders the area housed strong intent and is worthy of attention.
Figure 1.4 illustrates four areas, each exhibiting a persistent move that swallowed nearby highs/lows (black arrows).
(FIGURE 1.4)
Duration
How long price remains away from a supply or demand area is important.
It is said supply and demand zones work due to institutional traders leaving unfilled orders around the base of these areas. Logically, though, it is unlikely institutional traders leave unfilled orders in the market for long. The risk is too great.
Empirically speaking, research shows this is generally true. Areas where price spent a short duration of time from its zone appear the higher-probability setups to trade.
Figure 1.5 demonstrates this in action. Areas where price spent a considerable time away from the zone (see arrows) fared poorly. Now have a look at the ones which spent, at most, a week trading from the area (check points). Out of seven, two failed.
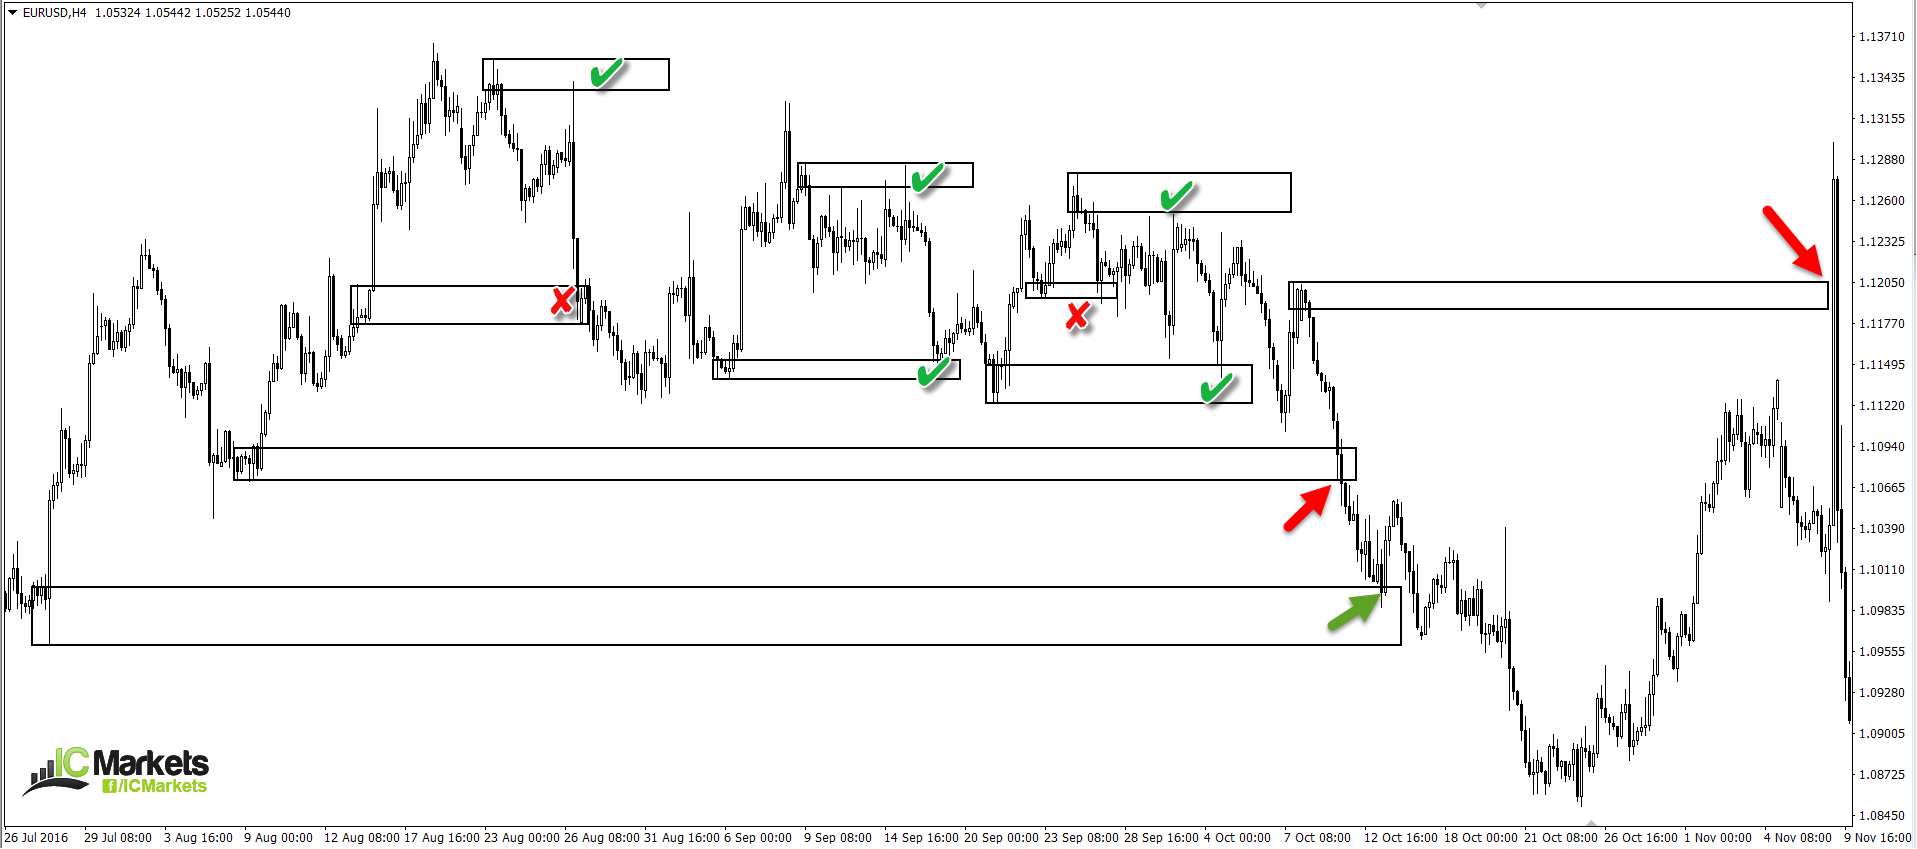
(FIGURE 1.5)
Fresh
Fresh is a term that often circulates trading forums.
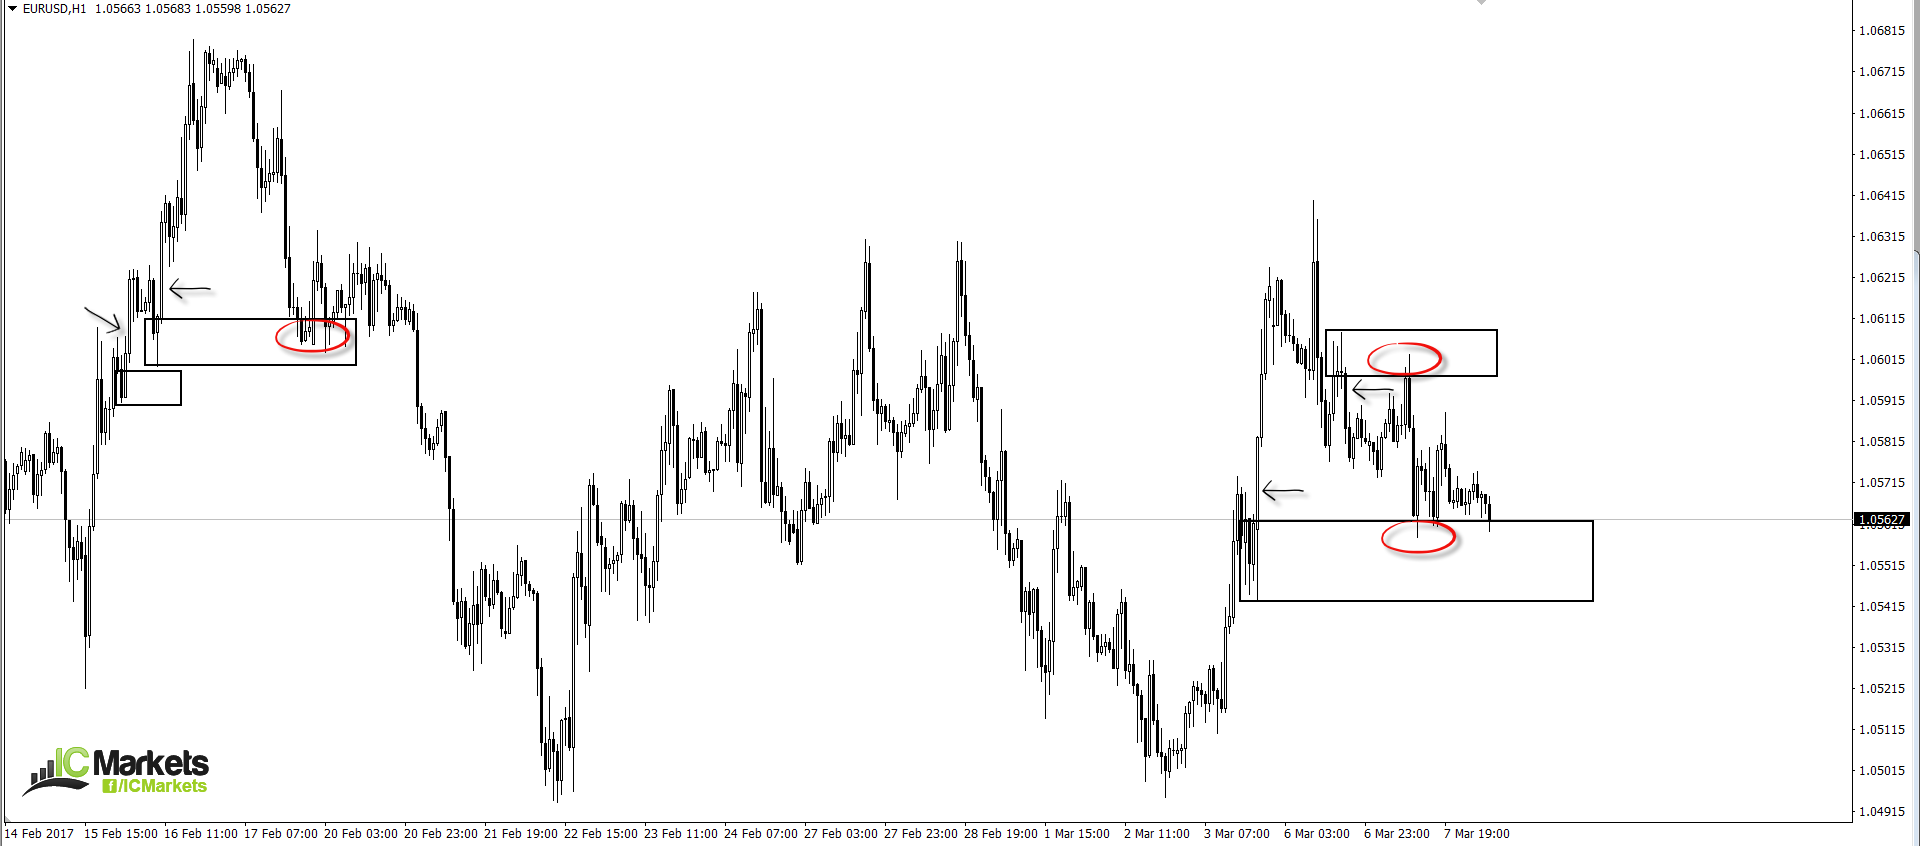
For a supply or demand area to be fresh, two conditions are required. Firstly, the zone forms without assistance from other structure. It cannot form from a reaction to another zone. Secondly, the base needs to be fresh/untouched. This is often difficult to picture, so figure 1.6 displays three fresh zones.
At point A, the supply area did not form from a reaction to another supply zone above. And at point B, until price retested the base of course, it was fresh and untouched. Trading the first time back has proven effective.
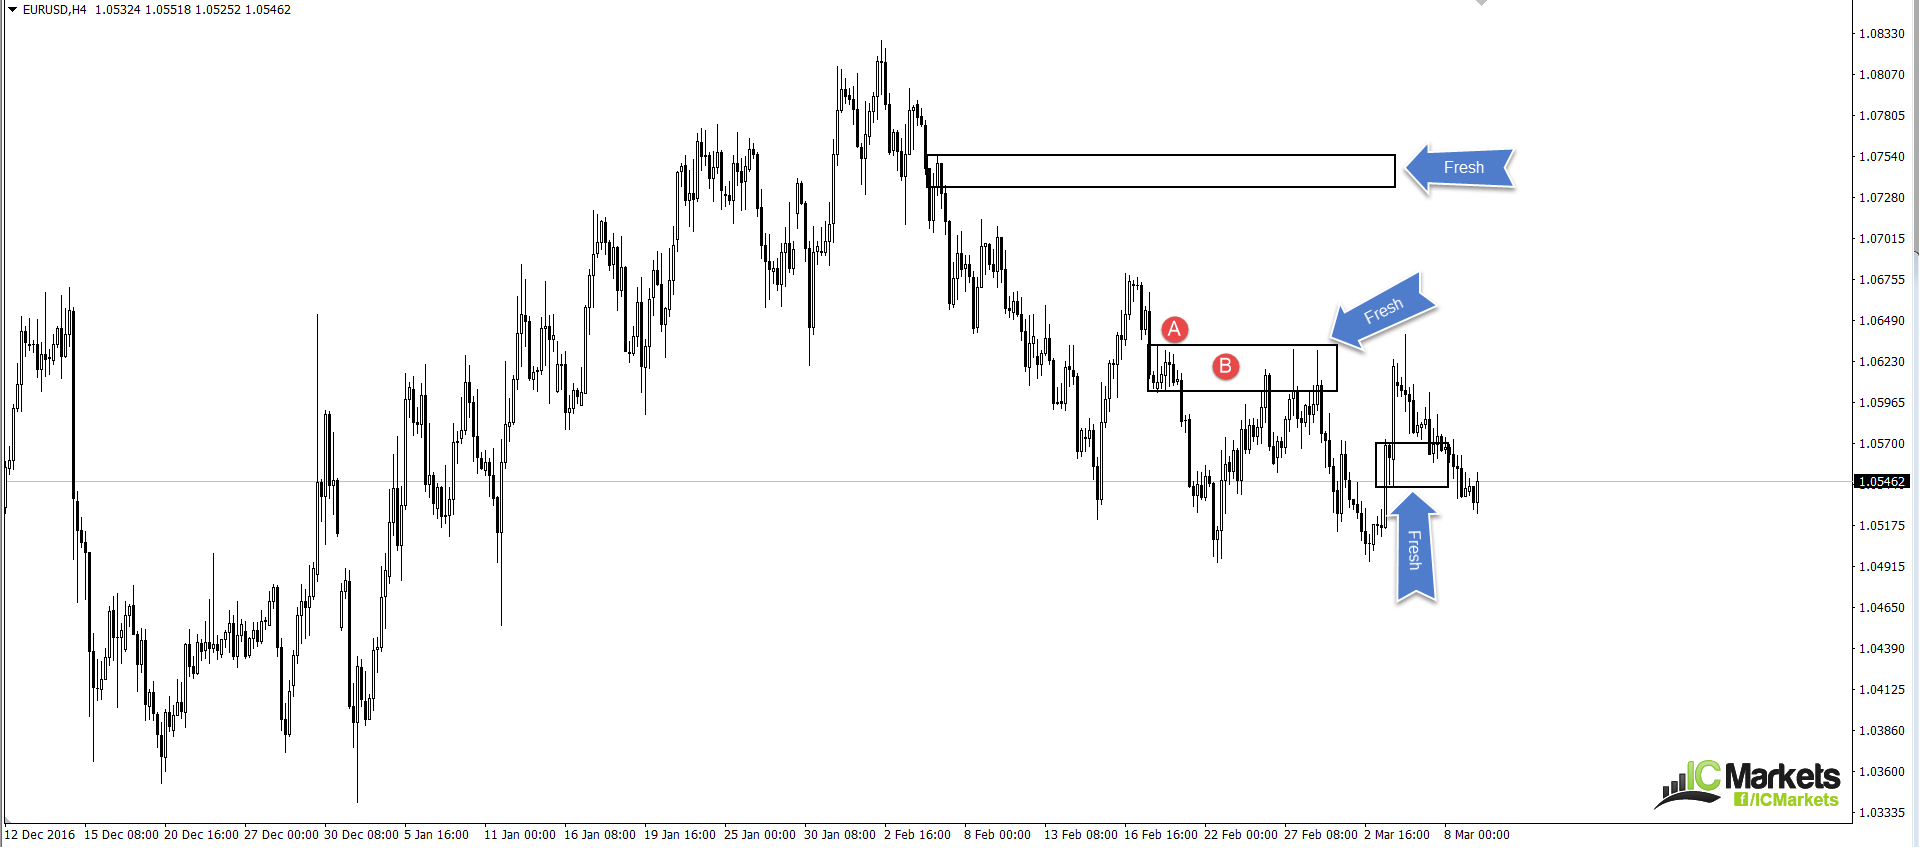
(FIGURE 1.6)
Trend direction
While trading with the immediate trend is often beneficial, traders also need to account for the fractal nature of the market. Just because a trend forms on the H1, it does not mean the daily timeframe, or even the H4 timeframe, will display a similar trend. If the H1, H4 and daily timeframes show a comparable trend, nevertheless, the chance of a successful trade from a H1 supply or demand area greatly increases.
It may also be worth taking the time to study multi-timeframe analysis, in regard to structure. Trading short from a supply zone on say, the H1 timeframe, may look great according to trend studies. But, if you fail to take into consideration what the higher-timeframe structure is doing, you may very well find you’re selling into a daily demand area. And this is not somewhere you want to place sell orders, no matter what the trend direction is suggesting.
Traders should always check where they are on the bigger picture, in relation to both the trend and structure. If, for example, there are no higher-timeframe obstacles and the overall trend is favourable, trading at nearby supply and demand zones have a higher probability of working out.
Using supply and demand in your trading
Trading supply and demand areas can be incredibly lucrative if approached correctly. Should you implement some of the mentioned methods in your trading plan, results will likely improve.
Trading is an amazing business, allowing participants freedom of expression to try out new methods.
Using supply and demand areas as a core factor in a strategy, traders also use the following concepts to further confirm an area’s validity:
- Trend line convergence. Should a trend line converge with your chosen supply or demand zone, the odds of a bounce being seen is enhanced.
- The approach. Is price forming an AB=CD harmonic approach or a three-drive pattern?
- Is there a psychological level or a long-term support/resistance level intersecting with your area?
The number of techniques used to confirm a supply or demand area is vast. Use this article as an introductory piece and begin formulating your very own supply and demand strategy.
Why not consider opening a demo account and practicing what you’ve learnt. It will help solidify the points made here and hopefully lead to further discovery.