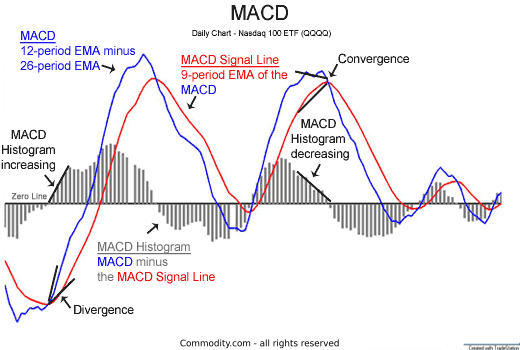
Penunjuk MACD adalah salah satu alat analisis teknikal yang paling popular. Terdapat tiga komponen utama MACD yang ditunjukkan dalam gambar di bawah:
The MACD indicator is one of the most popular technical analysis tools. There are three main components of the MACD shown in the picture below:
- MACD: Purata bergerak eksponen tempoh 12 (EMA) tolak EMA tempoh 26.
- Signal Line MACD: tempoh EMA(9)- MACD.
- MACD Histogram: MACD tolak MACD Signal Line.
- MACD: The 12-period exponential moving average (EMA) minus the 26-period EMA.
- MACD Signal Line: A 9-period EMA of the MACD.
- MACD Histogram: The MACD minus the MACD Signal Line.
Penunjuk MACD adalah alat serba boleh. Terdapat tiga cara utama untuk menafsirkan penunjuk analisis teknikal MACD, yang dibincangkan pada tiga bahagian berikut:
The MACD indicator is a versatile tool. There are three main ways to interpret the MACD technical analysis indicator, discussed on the following three sections:
- Moving Average Crossovers
- MACD Histogram
- MACD Divergences MACD
Moving Average Crossovers
Kaedah utama menafsirkan MACD adalah dengan crossover purata bergerak.
The primary method of interpreting the MACD is with moving average crossovers.
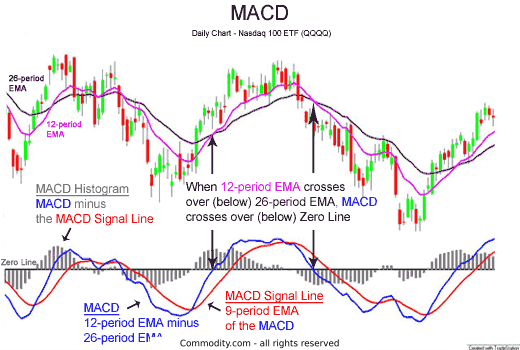
Apabila purata bergerak eksponensial (EMA) jangka masa 12 jangka pendek melintasi EMA jangka panjang 26, isyarat beli berpotensi dihasilkan; ini dapat dilihat pada carta Nasdaq 100 exchange traded fund (QQQQ) di bawah dengan dua garis ungu.
When the shorter-term 12-period exponential moving average (EMA) crosses over the longer-term 26-period EMA a potential buy signal is generated; this is seen on the Nasdaq 100 exchange traded fund (QQQQ) chart below with the two purple lines.
MACD moving average crossovers
Ingat bahawa garis MACD (garis biru) bergerak dari EMA 12-tempoh dan 26-tempoh. Oleh itu:
Remember that the MACD line (the blue line) is created from the 12-period and 26-period EMA. Consequently:
- Apabila EMA jangka pendek 12 melintasi di atas EMA jangka panjang 26, garis MACD melintasi di atas garis Zero.
- Apabila EMA 12 tempoh melintasi di bawah EMA tempoh 26, garis MACD melintasi di bawah garis Zero.
- When the shorter-term 12-period EMA crosses above the longer-term 26-period EMA, the MACD line crosses above the Zero line.
- When the 12-period EMA crosses below the 26-period EMA, the MACD line crosses below the Zero line.
Moving Average Crossover Potential Buy Signal
Kemungkinan isyarat beli dihasilkan apabila MACD (garis biru) melintasi di atas garis sifar.
A possible buy signal is generated when the MACD (blue line) crosses above the zero line.
Moving Average Crossover Potential Sell Signal
Apabila MACD melintasi di bawah garis sifar, maka kemungkinan isyarat jual dihasilkan.
When the MACD crosses below the zero line, then a possible sell signal is generated.
Isyarat beli dan jual yang berpotensi sebelumnya mungkin mendorong seseorang memasuki perdagangan kemudian dalam pertukaran saham atau masa depan. Satu lagi isyarat beli dan jual yang berpotensi ditunjukkan dalam graf di bawah dana Nasdaq 100 yang diperdagangkan QQQQ:
The prior potential buy and sell signals might get a person into a trade later in the move of a stock or future. Another potential buy and sell signal is shown in the graph below of the Nasdaq 100 exchange traded fund QQQQ:
Most Common MACD Potential Buy and Sell Signals
MACD Potential Buy Signal
Isyarat beli berpotensi dihasilkan apabila MACD (garis biru) melintasi di atas Garis Isyarat MACD (garis merah).
A potential buy signal is generated when the MACD (blue line) crosses above the MACD Signal Line (red line).
MACD Potential Sell Signal
Begitu juga, apabila MACD melintasi di bawah Garis Isyarat MACD kemungkinan isyarat jual dihasilkan.
Similarly, when the MACD crosses below the MACD Signal Line a possible sell signal is generated.
Crossover purata bergerak MACD adalah salah satu daripada banyak cara untuk menafsirkan penunjuk teknikal MACD. Menggunakan histogram MACD dan amaran perbezaan MACD adalah dua kaedah lain untuk menggunakan MACD.
The MACD moving average crossover is one of many ways to interpret the MACD technical indicator. Using the MACD histogram and MACD divergence warnings are two other methods of using the MACD.
MACD Histogram
Histogram MACD hanyalah perbezaan antara garis MACD (garis biru) dan garis isyarat MACD (garis merah). Histogram MACD digambarkan dalam carta di bawah Nasdaq 100 QQQQ’s:
The MACD Histogram is simply the difference between the MACD line (blue line) and the MACD signal line (red line). The MACD histogram is illustrated in the chart below of the Nasdaq 100 QQQQ’s:

Dua istilah penting berasal dari histogram MACD dan digambarkan di atas dalam carta QQQQ:
Two important terms are derived from the MACD histogram and are illustrated above in the chart of the QQQQ’s:
- Penumpuan: Histogram MACD menyusut tinggi. Ini berlaku kerana terdapat perubahan arah atau perlambatan trend saham, masa depan, bon, atau mata wang. Apabila itu berlaku, garis MACD semakin hampir dengan garis isyarat MACD.
- Divergence: Histogram MACD semakin tinggi (sama ada ke arah positif atau negatif). Ini berlaku kerana MACD bergerak lebih cepat ke arah arah aliran pasaran yang berlaku.
- Convergence: The MACD histogram is shrinking in height. This occurs because there is a change in direction or a slowdown in the stock, future, bond, or currency trend. When that occurs, the MACD line is getting closer to the MACD signal line.
- Divergence: The MACD histogram is increasing in height (either in the positive or negative direction). This occurs because the MACD is accelerating faster in the direction of the prevailing market trend.
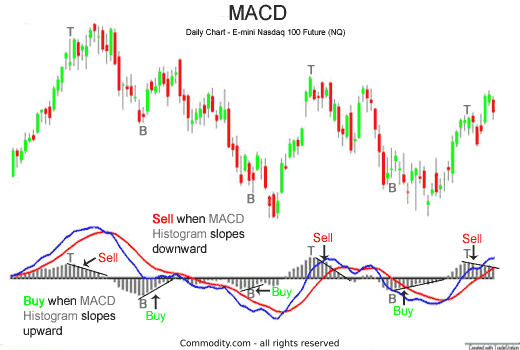
Apabila pasangan saham, masa depan, atau mata wang bergerak kuat ke arah, histogram MACD akan meningkat tinggi. Apabila histogram MACD tidak meningkat tinggi atau mulai menyusut, pasaran melambat dan mungkin memberi amaran kemungkinan berlakunya pembalikan. Grafik di bawah E-mini Nasdaq 100 Index Future menunjukkan fenomena ini:
When a stock, future, or currency pair is moving strongly in a direction, the MACD histogram will increase in height. When the MACD histogram does not increase in height or begins to shrink, the market is slowing down and might be warning of a possible reversal. The graph below of the E-mini Nasdaq 100 Index Future shows this phenomenon:

Huruf “T” menunjukkan ketika puncak atau puncak histogram MACD terjadi. Sebaliknya, huruf “B” menunjukkan ketika histogram bawah MACD terjadi. Perhatikan dalam contoh ini betapa dekatnya bahagian atas dan bawah histogram MACD dengan puncak tindakan harga masa depan Nasdaq 100 e-mini.
The letter “T” represents when the top or peak of the MACD histogram occurs. In contrast, the letter “B” shows when the bottom of the MACD histogram occurs. Notice in this example how closely the tops and bottoms of the MACD histogram are to the tops of the Nasdaq 100 e-mini future price action.
MACD Histogram Potential Buy Signal
Apabila histogram MACD berada di bawah garis sifar dan mula menyatu ke arah garis sifar.
When the MACD histogram is below the zero line and begins to converge towards the zero line.
MACD Histogram Potential Sell Signal
Apabila histogram MACD berada di atas garis sifar dan mula menyatu ke arah garis sifar.
When the MACD histogram is above the zero line and begins to converge towards the zero line.
Catatan: Dalam contoh di atas, tiga hari berturut-turut menyusut histogram MACD dari atas atau bawah berfungsi sebagai isyarat beli atau jual yang mungkin, ini ditunjukkan dengan anak panah.
Note: In the example above, three consecutive days of shrinking MACD histogram from top or bottom served as possible buy or sell signals, these are shown with arrows.
Ini adalah contoh agresif. Seorang peniaga mungkin menunggu sehingga histogram MACD menjadi sifar, tetapi itu akan menjadi isyarat yang sama dengan crossover purata bergerak MACD.
This is an agressive example. A trader might wait until the MACD histogram went to zero, but that would be the same signal as the MACD moving average crossover.
Selain memberi isyarat beli atau jual yang berpotensi, MACD dapat digunakan untuk peringatan tentang kemungkinan perubahan arah saham, niaga hadapan, dan pasangan mata wang.
In addition to signaling potential buy or sell signals, the MACD could be used for warnings of potential change in the direction of stocks, futures, and currency pairs.
MACD Divergences
Perbezaan bearish berlaku apabila indikator analisis teknikal menunjukkan bahawa harga harus turun tetapi harga saham, masa depan, atau pasangan mata wang terus mengekalkan aliran menaik semasa.
Bearish divergence occurs when a technical analysis indicator is suggesting that a price should be going down but the price of the stock, future, or currency pair is continuing to maintain its current uptrend.
Perbezaan kenaikkan berlaku ketika indikator menunjukkan bahawa harga harus turun dan menuju ke arah yang lebih tinggi, namun tindakan harga sebenarnya terus menurun.
Bullish divergence occurs when the indicator is indicating that price should be bottoming and heading higher, yet the actual price action is continuing downward.
Perbezaan ini mungkin memberi isyarat kepada peniaga untuk keluar dari kedudukan panjang atau pendek sebelum keuntungan merosot. Carta berikut dari E-mini S&P 500 Index Future menunjukkan beberapa perbezaan berikut:
These divergences might signal a trader to get out of a long or short position before profits erode. The following chart of the E-mini S&P 500 Index Future shows some of these divergences:
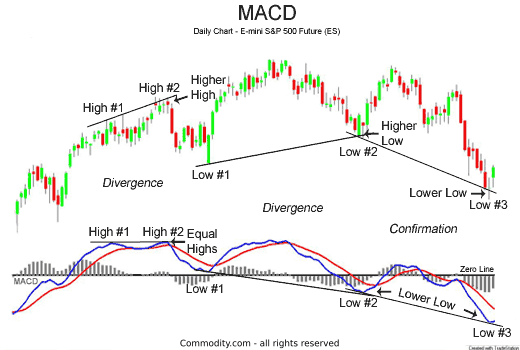
High #1 to High #2
Melihat masa depan E-mini S&P 500, dari High #1 hingga High #2, kontrak niaga hadapan membuat kenaikan yang lebih tinggi, yang biasanya dilihat sebagai bullish. Walau bagaimanapun, purata bergerak MACD gagal mencapai tahap tinggi baru. Perbezaan menurun ini bertindak sebagai tanda amaran awal mengenai perkara yang akan datang dengan kontrak niaga hadapan E-mini S&P 500.
Looking at the E-mini S&P 500 future, from High #1 to High #2, the futures contract made higher highs, which is usually viewed as bullish. However, the MACD moving average failed to make a new high. This bearish divergence acted as an early warning sign of things to come with the E-mini S&P 500 futures contract.
Low #1 to Low#2
Sebagai tanda bearish lain untuk kontrak niaga hadapan E-mini S&P 500, masa depan membuat terendah lebih rendah dari Rendah # 1 ke Rendah # 2, yang sekali lagi biasanya dianggap positif. Walaupun begitu, penunjuk teknikal MACD membuat tahap rendah yang rendah dari Rendah # 1 ke Rendah # 2. Perbezaan menurun ini memberi amaran akan penurunan masa depan S&P 500 dan pasaran secara keseluruhan.
In yet another bearish sign for the E-mini S&P 500 futures contract, the future made higher lows from Low #1 to Low #2, which again is usually considered positive. Nevertheless, the MACD technical indicator made a clear lower low from Low #1 to Low #2. This bearish divergence warned of the impending downturn of the S&P 500 future and the market as a whole.
Low #2 to Low #3
Selain perbezaan bearish dan bullish, MACD juga dapat mengesahkan pergerakan harga. Kontrak niaga hadapan E-mini S&P 500 mencapai tahap rendah yang rendah yang disahkan oleh MACD ketika rendah juga.
In addition to bearish and bullish divergences, the MACD might confirm price movement as well. The E-mini S&P 500 futures contract made a substantial lower low which was confirmed by the MACD when it made a lower low as well.
Seperti yang dilihat di seluruh bahagian MACD, MACD adalah alat serbaguna yang memberi pedagang kemungkinan membeli dan menjual entri dan memberi amaran mengenai kemungkinan perubahan harga.
As seen throughout the MACD sections, the MACD is a versatile tool giving a trader possible buy and sell entries and giving warnings of potential price changes.
Read more at: https://commodity.com/technical-analysis/macd/
Moving Average Convergence Divergence (MACD)
MACD juga merupakan salah sejenis indicator yang paling paling kerap digunakan. MACD biasanya dikira dengan menolak jumlah 12-EMA daripada 26-EMA. Bila MACD mempunyai nilai yang “positive”, dan MA shortterm berada diatas MA longterm, ini menunjukkan pergerakan ke arah atas, dan sebaliknya untuk MACD menghasilkan nilai bacaan yang “negative”. Kebanyakan traders jugak memerhati “garisan 0/neutral”, kaedah ini adalah sama dengan “MA crossover”. Di mana, cross ke atas memberikan signal untuk buy, dan cross kebawah memberikan signal untuk sell.
Contoh ini menunjukkan kegunakan MACD yang sangat asas. Persilangan atau “cross” jenis ini jugalah sama dengan “cross” yang boleh didapati dengan menggunakan MA
Oleh kerana MACD ialah indicator yang lagging, ia sepatutnya mengikut pergerakan pasaran. Seperti di contoh atas(graf 1H), kita boleh melihat yang MACD telah menghasilkan “divergence”. Divergence akan berlaku apabila MACD tidak mengikut harga pasaran.
Pada contoh di atas, kita boleh melihat yang pasaran telah membuat harga “low” yang baru (1), dan bulatan(1) di MACD juga merekod “low” yang baru. Ini berlaku sekali lagi(2), market telah membuat “low” yang baru, atau pasaran telah bergerak keharga yang lebih rendah dari low(1), tetapi MACD tidak menunjukkan bacaan yang lebih rendah dari bacaannya yang terakhir. Dan ini berlaku lagi(3).
Apabila keadaan ini berlaku, traders-traders tahu yang MACD telah menghasilkan “divergence”. Dalam keadaan ini, traders tahu yang harga pasaran bakal bertukar arah ke atas