Memahami sebab mengapa pasangan mata wang bergerak sangat penting untuk pengembangan setiap pedagang forex. Pada tahap paling asas, harga bergerak kerana ketidakseimbangan penawaran dan permintaan di pasaran pada waktu tertentu. Setelah anda dapat memahami konsep ini, anda dapat melihat perdagangan dari lensa logik.
Understanding the reason why a currency pair moves is essential to development of every forex trader. At the most basic level, price moves due to supply and demand imbalances in the market at any given time. Once you are able to grasp this concept, you can view trading from a logical lens.
Hari ini kita akan membincangkan strategi perdagangan penawaran dan permintaan dalam Forex. Kami akan belajar bagaimana mengenal pasti tahap penawaran dan permintaan dan bagaimana menerapkan tahap dalam strategi perdagangan yang komprehensif. Muat turun versi PDF yang boleh dicetak ringkas yang merangkum perkara utama pelajaran ini …. Klik Di Sini untuk Muat turun
Today we will discuss supply and demand trading strategies in Forex. We will learn how to identify supply and demands levels and how to apply the levels within a comprehensive trading strategy. Download the short printable PDF version summarizing the key points of this lesson….Click Here to Download
Penawaran dan Permintaan dalam Perdagangan
Supply and Demand in Trading
Konsep penawaran dan permintaan adalah komponen teras teori ekonomi. Peraturan Penawaran dan Permintaan menyatakan bahawa jika penawaran komoditi tinggi dan permintaan rendah, ini menghasilkan lebihan yang mendorong harga turun. Dan sebaliknya, jika penawaran komoditi rendah dan permintaan tinggi, ini akan menyebabkan kelangkaan, mendorong harga lebih tinggi.
The supply and demand concept is a core component of economic theory. The Supply and Demand rule states that if the supply of a commodity is high and the demand is low, this generates excess which drives the price down. And conversely, if the supply of a commodity is low and the demand is high, this creates a scarcity, pushing the price higher.
Peraturannya cukup mudah difahami dan dapat diterapkan pada apa saja, yang termasuk dalam kumpulan sumber daya yang dapat diperdagangkan.
The rule is pretty easy to understand and it could be applied to anything, which falls in the group of tradable resources.
Diterapkan ke pasaran forex, jika penawaran untuk pasangan mata wang tinggi dan permintaan rendah, ini akan mendorong harga lebih rendah. Sekiranya penawaran untuk pasangan mata wang rendah dan permintaan tinggi, ini akan mendorong kenaikan harga.
Applied to the forex market, if the supply for a currency pair is high and the demand is low, it will drive prices lower. If the supply for a currency pair is low and the demand is high, this will act to drive prices higher.
Penawaran dan permintaan pasangan mata wang ditentukan oleh para pemain di pasaran Forex. Ini adalah pemerintah, bank, pelabur, dana, dan spekulator. Melalui tindakan mereka di pasaran, para peserta di pasaran Forex terus mengubah penawaran dan permintaan pasangan mata wang, menyebabkan harga berubah-ubah. Sekiranya anda membuka perdagangan mata wang, anda akan mengambil bahagian dalam persamaan penawaran dan permintaan dalam pasaran tersebut.
The supply and demand of a currency pair is determined by the players in the Forex market. These are governments, banks, investors, funds, and speculators. Thru their actions in the market, the participants in the Forex market are constantly shifting the supply and demand of currency pairs, causing the price to fluctuate. If you open a currency trade you are taking part in the supply and demand equation within that market.
What are Supply and Demand Zones in Forex
The supply and demand imbalances in Forex can be seen visually on the price chart. Each tick on the graph represents changes in the traders’ attitude toward the respective pair. Thus, if traders have a certain bias for a currency pair at a certain level, this can be recognized on the Forex chart by the informed trader.
For example, if the currency pair is moving downwards on selling pressure, some traders will position pending buy orders at certain levels below the price. These people do not believe that the pair will go much lower beyond their buy limit order. They place buy orders at this level to purchase the pair on the assumption that the bearish move is likely to stall. If a large group of people do this, or even if a large institution does this, there will be accumulated a big volume of pending orders around this specific level. This means the demand will increase as price reaches this level, which is likely to cause a sharp price increase as price approaches this level.
The same is in force in the opposite direction as well. When big volumes are accumulated at a certain level above the price, the supply will increase, which can cause the price to drop sharply upon reaching that supply zone.
As such, traders should be aware of these two important levels within their charts, where prices are likely to rise and fall – the Demand Zone and the Supply Zone.
Demand Zone
Zon Permintaan adalah kawasan harga di bawah tindakan harga semasa di mana terdapat minat membeli yang kuat. Melihat carta di bawah ini, kita dapat melihat bahawa terdapat banyak minat beli di zon permintaan, kemungkinan besar disebabkan oleh banyak pesanan pesanan rehat pada tahap ini. Untuk alasan ini, ketika harga mencapai tingkat permintaan, seperti yang ditunjukkan di bawah ini, pesanan dapat dilaksanakan dan sebahagian tertentu dari jumlah pesanan yang tertunda diserap. Biasanya, anda akan melihat reaksi harga yang tajam dari Zon Permintaan, dan semakin cepat reaksi harga, semakin banyak pesanan beli yang tertunda berada di sana.
A Demand Zone is a price area below the current price action where there is strong buying interest. Looking at the chart below, we can see that there was a lot of buying interest at the demand zone, most likely caused by a large volume of resting buy orders at this level. For this reason, when the price reaches the demand level, as shown below, the orders get executed and a certain portion of the pending order volume gets absorbed. Typically, you will notice a sharp price reaction from the Demand Zone, and the sharper the price reaction, the more pending buy orders are resting there.
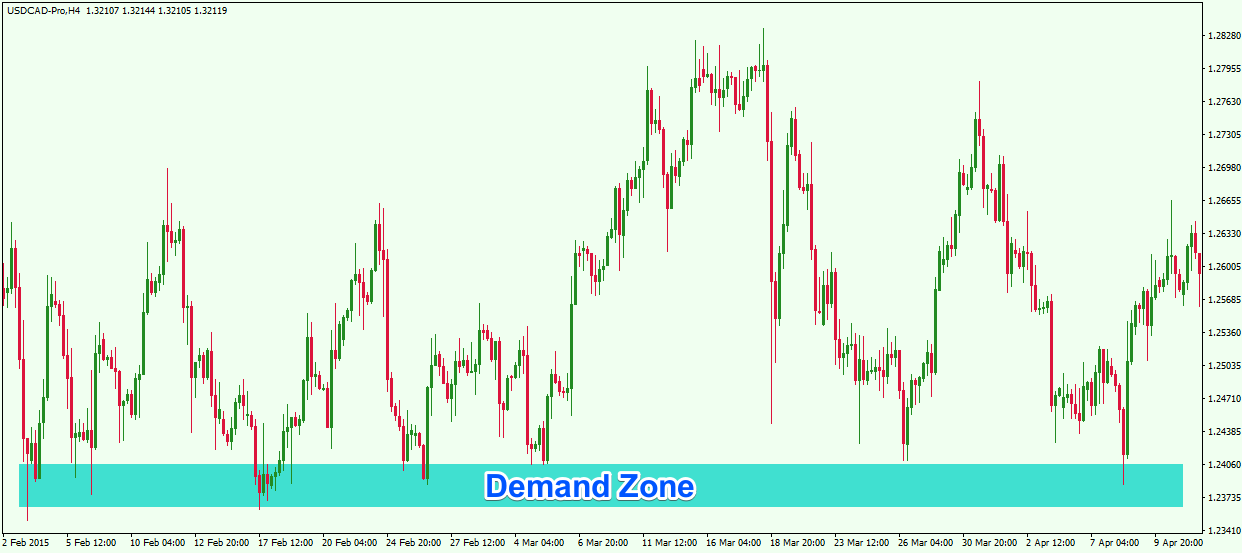
Di atas anda melihat carta H4 pasangan Forex USD / CAD menunjukkan zon permintaan yang kuat antara 1.2400 dan 1.2360. Perhatikan bahawa setiap interaksi dengan tahap ini menghasilkan kenaikan harga. Penting untuk merujuk kepada tahap Permintaan sebagai kawasan dan bukan sebagai satu baris pada carta.
Above you see the H4 chart of the USD/CAD Forex pair showing a strong demand zone between 1.2400 and 1.2360. Notice that every interaction with this level results in a price increase. It is important to refer to the Demand levels as an area and not as a single line on the chart.
Zon Bekalan
Supply Zone
Zon Penawaran adalah kebalikan dari Zon Permintaan. Kawasan penawaran terletak di atas tindakan harga dan biasanya mengandungi jumlah pesanan jual yang agak besar. Apabila tindakan harga mencapai tahap ini, pesanan mulai dilaksanakan. Pedagang menjual pasangan Forex dan tindakan harga membalikkan kepada penurunan. Seperti Permintaan, zon Penawaran merujuk kepada kawasan dan bukan satu tingkat.
The Supply Zone is the exact opposite of the Demand Zone. A Supply area is located above the price action and it typically contains a relatively big volume of sell orders. When the price action reaches this level, the orders start to get executed. Traders are selling the Forex pair and the price action reverses to the downside. As with the Demand, the Supply zone refers to an area and not a single level.
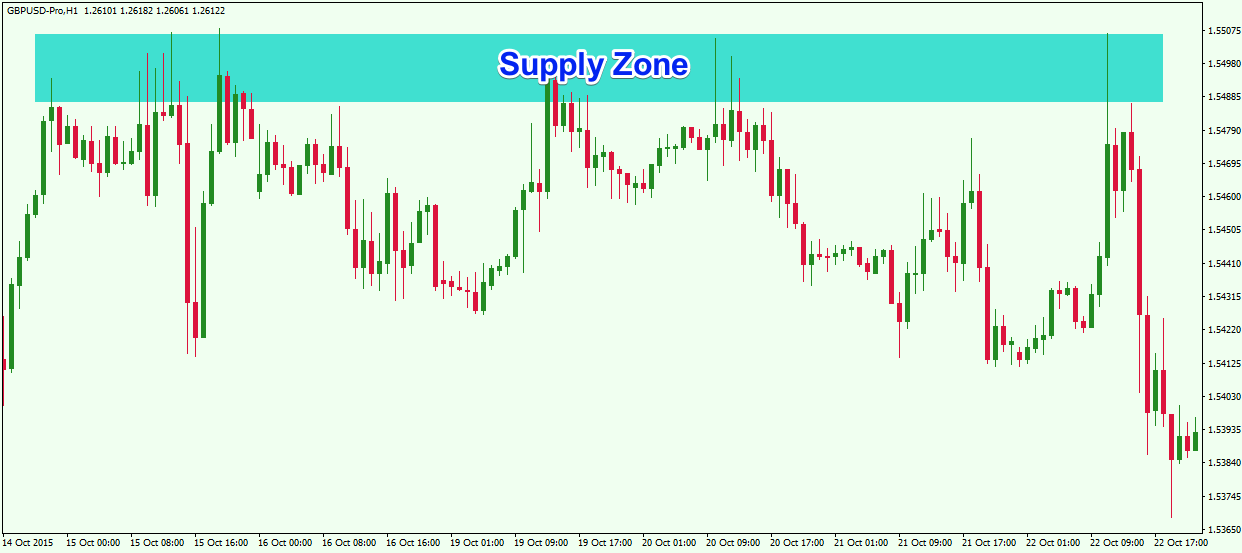
Sekarang kita mempunyai carta H1 pasangan GBP / USD. Kali ini gambar menunjukkan zon bekalan pada carta. Lihat bahawa setiap kali tindakan harga berinteraksi dengan kawasan penawaran ini, kita akan melihat penurunan harga.
Now we have the H1 chart of the GBP/USD Forex pair. This time the image shows a supply zone on the chart. See that every time the price action interacts with this supply area we see a decrease in the price.
Seperti disebutkan sebelumnya, ketika tindakan harga mencapai zon penawaran atau permintaan, kemungkinan akan membalikkan arahnya. Oleh itu, zon ini digunakan oleh peniaga tindakan harga untuk memasuki pasar ke arah masing-masing.
As noted earlier, when the price action reaches a supply or demand zone, it is likely to reverse its direction. Therefore, these zones are used by price action traders to enter the market in the respective direction.
Sekiranya tindakan harga menurun ke zon permintaan dan melambung ke atas, ini memberi peluang untuk memperdagangkan pasangan mata wang ke atas. Apabila harga melonjak ke kawasan penawaran dan melambung ke bawah, ini memberi peluang untuk memperdagangkan pasaran ke arah penurunan. Ketahui Apa Yang Berfungsi dan Apa Yang Tidak Ada Di Pasaran Forex…. Sertailah Buletin Percuma Saya yang Dikemas dengan Petua dan Strategi yang Boleh Dilakukan Untuk Menjana Keuntungan Dagangan Anda… ..Klik Di Sini untuk Menyertai
If the price action decreases to a demand zone and bounces upwards, this creates an opportunity to trade the currency pair upwards. When the price jumps to a supply area and bounces downwards, this creates an opportunity to trade the market in a bearish direction. Learn What Works and What Doesn’t In the Forex Markets….Join My Free Newsletter Packed with Actionable Tips and Strategies To Get Your Trading Profitable…..Click Here to Join
Melukis Zon Penawaran dan Permintaan
Drawing Supply and Demand Zones
Adalah idea yang baik untuk menarik kawasan penawaran dan permintaan pada carta. Dengan cara ini anda akan mengetahui secara visual di mana zon berada, dan bersiaplah untuk memperdagangkan pasaran apabila harganya mencapai zon S / D yang sesuai.
It is always a good idea to draw the supply and demand areas on the chart. This way you will be aware visually where the zones are, and be prepared to trade the market when the price reaches the appropriate S/D zone.
Bagaimana Mencari Kawasan Penawaran dan Permintaan pada Carta
How to Find Supply and Demand Area on the Chart
Oleh itu, persoalan semula jadi menjadi: “Bagaimana saya mencari kawasan penawaran dan permintaan pada carta?” Mengenal pasti zon penawaran dan permintaan cukup mudah setelah anda mengetahui apa yang perlu dicari. Pertama, zum keluar carta jangka masa perdagangan anda dan beralih ke jangka masa tahap lebih tinggi seterusnya. Jangka masa tahap seterusnya adalah 4x atau 5x, jangka masa perdagangan anda. Dengan melakukan ini, anda akan dapat melihat secara keseluruhan tindakan harga.
So then the natural question becomes: “How do I find supply and demand areas on the chart?” Identifying supply and demand zones is fairly straightforward once you know what to look for. First, zoom out your trading time frame chart and switch to the next higher level time frame. The next level timeframe is 4x or 5x, your trading timeframe. By doing this, you will have a bird’s eye view on the overall price action.
Kemudian cari titik perubahan dalam tindakan harga di mana harga telah bertindak balas dengan mendadak. Biasanya, titik perubahan di mana harga bergerak dengan cepat dari tahap ke bawah, boleh dianggap sebagai tahap penawaran. Dan sebaliknya, titik perubahan di mana harga bergerak dengan cepat dari tahap ke atas, dapat dianggap sebagai tahap permintaan.
Then find turning points in the price action where prices have reacted sharply. Typically, a turning point where the price moves quickly away from the level downwards, can be considered a supply level. And conversely, a turning point where the price moves quickly away from the level upwards, can be considered a demand level.
Apabila anda menjumpai zon pusingan, ambil objek lukisan bentuk segi empat tepat dari platform perdagangan anda dan luruskan ke kanan. Sebagai alternatif, terdapat beberapa petunjuk perdagangan penawaran dan permintaan yang tersedia di pasaran yang mungkin dapat anda gunakan.
When you find the turning point zone simply grab a rectangular shape drawing object from your trading platform and stretch it to the right. Alternatively, there are some supply and demand trading indicators that are available in the market that you may be able to use.

Di atas anda akan melihat carta Mingguan AUD / USD yang memaparkan tahap bekalan.
Above you will see the Weekly chart of the AUD/USD which displays a supply level.
Analisis Penawaran dan Permintaan dalam Forex
Supply and Demand Analysis in Forex
Sistem perdagangan berdasarkan penawaran dan permintaan adalah kaedah perdagangan Forex yang agak mudah tetapi kuat. Ia dianggap sebagai salah satu mitologi perdagangan tindakan harga paling murni di sekitar.
A supply and demand based trading system is a relatively simple, yet powerful way to trade Forex. It is considered one of the purest price action trading mythologies around.
Peraturan analisis penawaran dan permintaan dalam Forex cukup mudah. Anda harus membeli apabila tindakan harga mendekati tahap permintaan dan melambung ke atas. Anda menjangkakan harganya akan meningkat akibat pesanan pembelian agregat di zon permintaan. Oleh itu, anda berpeluang menaikkan harga yang akan datang.
The rules of supply and demand analysis in Forex are quite simple. You should buy when the price action approaches a demand level and bounces upwards. You expect the price to increase as a result of the aggregated buy orders in the demand zone. Therefore, you have the opportunity to ride an upcoming price swing.
Anda harus menjual apabila harga mencapai tahap bekalan dan melambung ke bawah. Anda menganggap bahawa tindakan harga akan mulai mencetuskan pesanan penjualan agregat di kawasan tersebut, yang kemungkinan akan menyebabkan penurunan harga. Oleh itu, ini memberi peluang untuk melakukan pergerakan penurunan harga pada chart.
You should sell when the price reaches a supply level and bounces downwards. You assume that the price action will begin to trigger the aggregated sell orders in the area, which is likely to lead to a price drop. Thus, this creates an opportunity to ride a bearish move on the chart.
Anda akan membuat pesanan stop loss tepat di bawah kawasan permintaan ketika anda berada lama di pasaran. Sebaliknya, buat pesanan stop loss anda tepat di atas kawasan bekalan.
You would put a stop loss order right below the demand area when you are long in the market. Conversely, put your stop loss order right above the supply area.
Pendekatan yang paling biasa adalah menahan perdagangan anda sehingga tindakan harga mencapai tahap yang bertentangan pada carta. Oleh itu, jika anda berdagang dengan panjang permintaan, anda harus menahan perdagangan anda sehingga tindakan harga mencapai zon bekalan seterusnya pada carta. Sebaliknya, jika anda berdagang pendek dengan tahap penawaran, maka anda harus menahan perdagangan sehingga harga mencapai tahap permintaan seterusnya pada grafik.
The most common approach is to hold your trades until the price action reaches the opposite level on the chart. So, if you are trading long a demand level, you should hold your trade until the price action reaches the next supply zone on the chart. Opposite to this, if you are trading short a supply level, then you should hold your trade until the price reaches the next demand level on the graph.
Namun, berkali-kali, tidak ada tingkat yang jelas untuk ditargetkan atau mungkin terlalu jauh. Selalunya harga mungkin tidak dapat mencapai tahap yang berlawanan semasa bergerak. Oleh itu, saya cadangkan anda juga menggunakan analisis tindakan berdasarkan harga yang mudah semasa anda menentukan titik keluar anda pada carta. Untuk melakukan ini, anda boleh menggunakan petunjuk tindakan harga yang berbeza seperti trend, saluran, atau dengan menganalisis swing top dan bottom.
Many times, however, there is no clear level to target or it may be too far away. Often the price may not likely be able to reach an opposite level during its move. Therefore, I suggest you also use simple price action derived analysis when you determine your exit point on the chart. To do this, you can use different price action clues such as trends, channels, or by analyzing swing tops and bottoms.
Penawaran dan Permintaan Perdagangan dengan Pengurusan
Trading Supply and Demand with Price Action Trade Management
Sekarang mari kita menerapkan panduan di atas menjadi contoh perdagangan Penawaran dan Permintaan.
Now let’s apply the guidelines above into a Supply and Demand trading example.
Perdagangan Tindakan Harga
Kami mempunyai gambar keluar dari grafik H1 GBP / USD. Di sudut kiri bawah, kita melihat zon penawaran dan permintaan. Zon permintaan ditandai dengan biru dan zon penawaran ditunjukkan dengan magenta. Lihat bahawa tindakan harga membuat zon permintaan setelah penurunan sebelumnya. Harga melambung beberapa kali dari zon permintaan, dan kami akan mempunyai beberapa peluang untuk memasuki perdagangan.
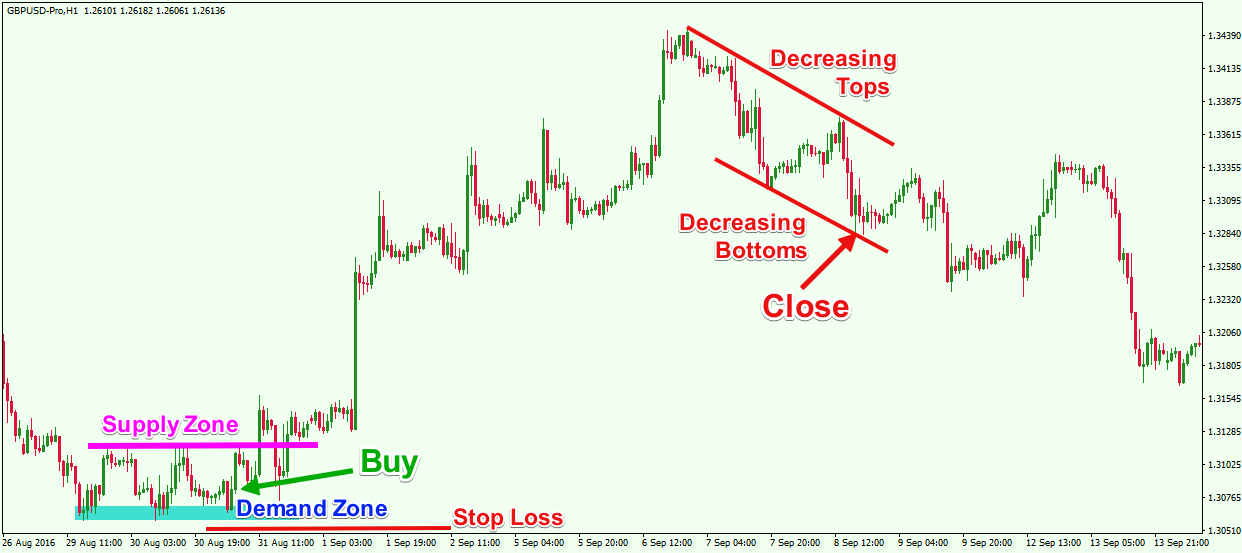
We have a zoomed out picture of the H1 GBP/USD chart. At the bottom left corner we see a supply and demand zone. The demand zone is marked with blue and the supply zone is indicated with magenta. See that the price action creates the demand zone after a previous decrease. The price bounces several times from the demand zone, and we would have had several opportunities to enter the trade.
Kami menganggap bahawa zon permintaan akan mencetuskan pesanan panjang baru, yang akan mendorong harga ke atas. Perintah stop loss harus diletakkan di bawah zon permintaan seperti yang ditunjukkan pada gambar.
We assume that the demand zone will trigger new long orders, which will push the price upwards. The stop loss order should be placed below the demand zone as shown on the image.
Perhatikan ketika harga meningkat dari zon permintaan, sehingga akhirnya mencapai zon penawaran terdekat di atas. Walau bagaimanapun, tindakan harga menembusi tahap dengan momentum tinggi yang mengarahkan kita pada tahap yang tidak kuat, dan GBP / USD mungkin akan melanjutkan kenaikan harga. Atas sebab ini perdagangan dapat diadakan dengan anggapan kenaikan akan berterusan.
Notice as the price increases from the demand zone, that it eventually reaches the nearest supply zone above. However, the price action breaks the level with high momentum cluing us in that the level is not strong, and that the GBP/USD might extend its bullish run. For this reason the trade could be held on the assumption that the increase will continue.
Inilah sebenarnya yang berlaku. Harga memulakan rali baru. Dalam perjalanan ke atas, kita melihat kenaikan puncak dan kenaikan bawah, yang mengesahkan bahawa GBP / USD berada dalam tren kenaikan yang kuat. Kenaikan berterusan selama 1 minggu. Sikap lemah lembut ditunjukkan selepas itu. Saluran bearish merah pada carta menunjukkan penurunan bahagian atas dan penurunan bawah. Ini adalah petunjuk kuat bahawa tren kenaikan kemungkinan akan berakhir dan bahawa aliran menurun mungkin berlaku. Oleh itu, akan menjadi pilihan yang baik untuk keluar dari perdagangan di bahagian bawah kedua pada carta setelah penciptaan dua puncak menurun. Sekarang mari kita tunjukkan senario sebaliknya, contoh perdagangan sisi penawaran:
This is exactly what happens. The price initiates a new rally. On the way up we see increasing tops and increasing bottoms, which confirms that the GBP/USD is in a strong bullish trend. The increase continues for 1 week. A bearish attitude is demonstrated afterwards. The red bearish channel on the chart shows decreasing tops and decreasing bottoms. This is a strong indication that the bullish trend is most likely finished and that a bearish trend might ensue. Therefore, it would be a good option to exit the trade on the second descending bottom on the chart after the creation of the two descending tops. Now let’s demonstrate the opposite scenario, a supply side trading example:
Carta harian USD / JPY di atas menunjukkan contoh perdagangan dengan zon bekalan.
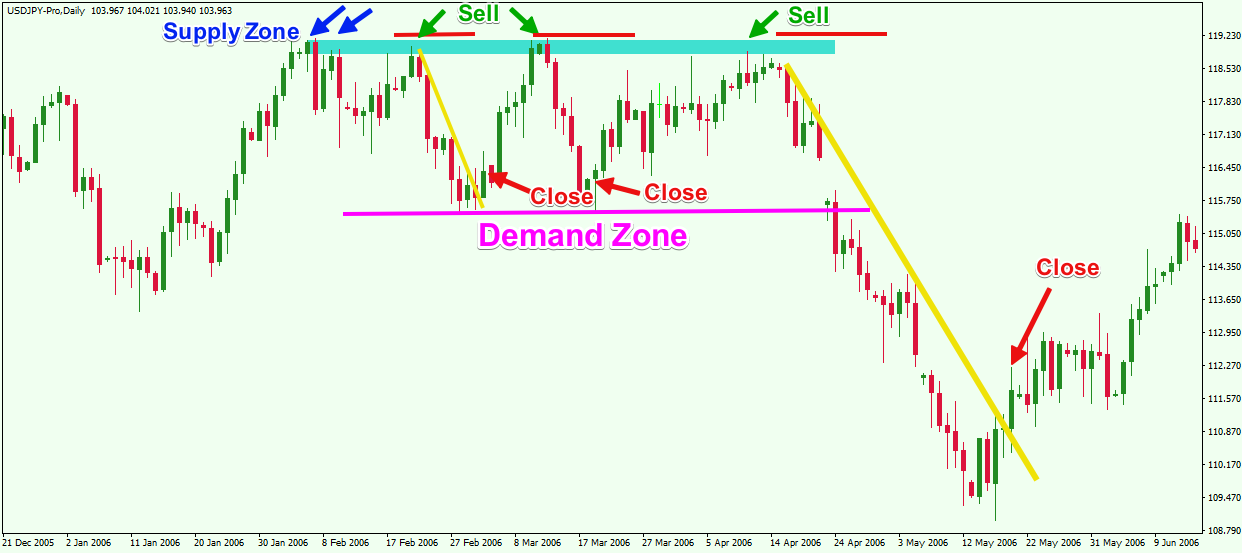
This daily chart of the USD/JPY above shows a trade example with a supply zone.
Dua anak panah biru kecil pada carta menunjukkan penciptaan dua puncak pertama di zon bekalan. Kami akan mencari perdagangan pendek yang berinteraksi dengan tahap itu.
The two small blue arrows on the chart show the creation of the first two tops in the supply zone. We will look for Short trades that interact with that level.
USD / JPY dapat dijual setelah melantun seperti yang ditunjukkan dengan anak panah hijau pertama pada grafik. Harga mula menurun selepas itu. Tidak lama kemudian, swing swing diciptakan dan kami melihat harga yang tajam bergerak ke atas. Kawasan ini seterusnya membentuk zon permintaan kukuh pada carta.
The USD/JPY could be sold after the bounce as shown with the first green arrow on the chart. The price starts decreasing afterwards. Soon after, a swing low is created and we see a sharp price move to the upside. This area subsequently forms a solid demand zone on the chart.
Harga kembali ke zon bekalan untuk ujian semula selepas itu. Lihat bahawa USD / JPY melambung tajam ke arah penurunan. Ini mewujudkan peluang pendek lain pada carta. Pasangan ini dapat dijual semula setelah melambung dari tahap. Selepas harga menurun, ia mencapai tahap permintaan magenta pada carta, membuat lonjakan lain. Perdagangan pendek kedua boleh ditutup apabila anda menyedari lonjakan dari garis permintaan magenta.
The price returns to the supply zone for a re-test afterwards. See that the USD/JPY bounces sharply in the bearish direction. This creates another short opportunity on the chart. The pair could be sold again after the bounce from the level. After the price decreases, it reaches the magenta demand level on the chart, creating another bounce. The second short trade could be closed when you recognize the bounce from the magenta demand line.
Harga kembali ke zon bekalan dan melantun kembali ke bawah. Ini membawa kepada penurunan harga baru. Walau bagaimanapun, kali ini tindakan harga membuat jurang pasaran yang kuat turun dan hampir melalui zon permintaan yang sudah ditetapkan, yang bermaksud bahawa kekuatan penurunan lebih kuat daripada biasa. Dalam kes ini, anda akan mempunyai alasan yang cukup untuk menahan perdagangan dengan anggapan tekanan jual telah mengambil alih, dan pasangan ini memasuki tren penurunan harga.
The price returns to the supply zone and bounces again downwards. This leads to a new price decrease. However, this time the price action creates a strong market gap down and almost goes through the already established demand zone, meaning that the bearish force is stronger than usual. In this case you would have had a sufficient reason to hold the trade on the assumption that the selling pressure has taken over, and the pair is entering a bearish trend.
Kami menggunakan garis arah aliran menurun kuning yang besar untuk mengukur keamatan pergerakan ke bawah. Kemudian kami menahan perdagangan sehingga tindakan harga menembusi garis tren penurunan kuning. Anak panah merah terakhir menunjukkan saat ketika penembusan harga melalui garis tren ke arah atas, yang akan menjadi isyarat yang sah bahawa perdagangan perlu ditutup.
We use the big bearish yellow trend line to measure the intensity of the downwards move. Then we hold the trade until the price action breaks the yellow bearish trend line. The last red arrow shows the moment when price breaks thru the trend line to the upside, which would be a valid signal that the trade needs to be closed.
Perintah stop loss untuk tiga perdagangan pendek ditunjukkan dengan garis mendatar merah di atas zon bekalan. Muat turun versi PDF yang boleh dicetak ringkas yang merangkum perkara utama pelajaran ini …. Klik Di Sini untuk Muat turun
The stop loss orders for the three short trades are indicated with the red horizontal lines above the supply zone. Download the short printable PDF version summarizing the key points of this lesson….Click Here to Download
Kesimpulannya
Conclusion
- Peraturan penawaran dan permintaan menyatakan bahawa: / The rule of supply and demand states that:
- Harga meningkat apabila permintaan lebih tinggi dan penawaran lebih rendah. / Price increases when demand is higher and supply is lower.
- Harga menurun apabila penawaran lebih tinggi dan permintaan lebih rendah. / Price decreases when supply is higher and demand is lower.
- Peraturan penawaran dan permintaan yang diterapkan dalam perdagangan Forex bermaksud: / The supply and demand rule applied in Forex trading means:
- Harga meningkat apabila terdapat tekanan beli (permintaan) yang tinggi. / Price increases when there is a high buying pressure (demand).
- Harga menurun apabila terdapat tekanan jual (penawaran) yang tinggi. / Price decreases when there is a high selling pressure (supply).
- Zon penawaran dan permintaan dalam Forex adalah titik perubahan di mana tindakan harga cenderung akan berubah. / Supply and demand zones in Forex are turning points where the price action is likely to reverse.
- Tahap ini dapat dinyatakan secara visual di carta Forex: / These levels can be visually expressed on the Forex charts:
- Tahap permintaan terletak di bawah tindakan harga dan diharapkan dapat menimbulkan tekanan beli kerana pesanan yang belum selesai / belum selesai di kawasan tersebut. / A demand level is located below the price action and it is expected to create buying pressure due to pending / unfilled orders in that area.
- Tahap penawaran terletak di atas tindakan harga dan diharapkan dapat menimbulkan tekanan penjualan kerana pesanan yang belum selesai / belum selesai di kawasan tersebut. / A supply level is located above the price action and it is expected to create selling pressure due to pending / unfilled orders in that area.
- Untuk melukis zon penawaran atau permintaan pada carta Forex, anda harus: / To draw a supply or demand zone on the Forex chart you should:
- Kenal pasti kawasan di mana tindakan harga telah membuat tahap swing dengan pergerakan harga yang tajam. / Identify an area where the price action has created a swing level with a sharp price move.
- Regangkan alat lukisan segi empat dari kiri ke kanan untuk menandakan kawasan tersebut / Stretch a rectangle drawing tool from left to right to mark the area
- Untuk memperdagangkan metodologi penawaran dan permintaan dalam Forex, anda harus: / To trade supply and demand methodology in Forex you should:
- Beli apabila harga melambung naik dari kawasan permintaan. Letakkan stop loss di bawah zon. / Buy when the price bounces upwards from a demand area. Place a stop loss below the zone.
- Jual apabila harga melambung ke bawah dari kawasan bekalan. Letakkan perhentian di atas zon. / Sell when the price bounces downwards from a supply area. Place a stop above the zone.
- Pegang perdagangan anda sekurang-kurangnya sehingga tindakan harga mencapai tahap yang bertentangan pada carta atau gunakan peraturan tindakan harga untuk menguruskan perdagangan. / Hold your trade at least until the price action reaches an opposite level on the chart or use price action rules to manage the trade.