Stochastic Fast
Stochastic Fast plots the location of the current price in relation to the range of a certain number of prior bars (dependent upon user-input, usually 14-periods).
In general, stochastics are used in an attempt to uncover overbought and oversold conditions.
Above 80 is generally considered overbought and below 20 is considered oversold.
The inputs to Stochastic Fast are as follows:
- Fast %K: [(Close – Low) / (High – Low)] x 100
- Fast %D: Simple moving average of Fast K (usually 3-period moving average)
Stochastic Slow
Stochastic Slow is similar in calculation and interpretation to Stochastic Fast.
The difference is listed below:
- Slow %K: Equal to Fast %D (i.e. 3-period moving average of Fast %K)
- Slow %D: A moving average (again, usually 3-period) of Slow %K
The Stochastic Slow might be viewed as superior due to the smoothing effects of the moving averages which equates to less false potential buy and sell signals.
A comparison of the two stochastics, fast and slow, is shown below in the chart of the Nasdaq 100 ETF (QQQQ):
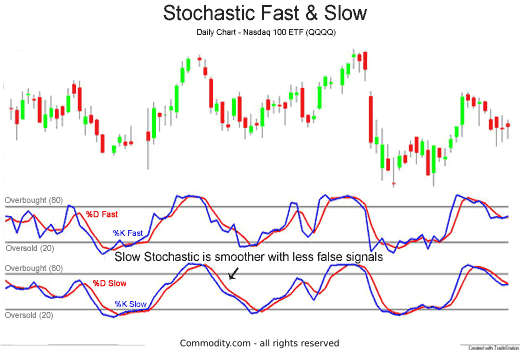
Comparison of Stochastic Fast and Stochastic Slow The next few sections discuss possible buy and sell signals and how stochastics may outline areas of overbought or oversold price conditions.
Stochastics Buy & Sell
Stochastics Potential Buy Signal
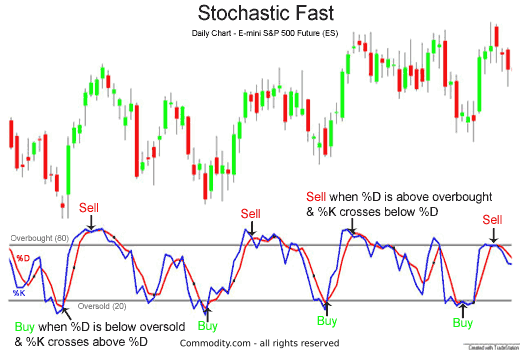
A trader might interpret a buy signal when the Stochastic is below the 20 oversold line and the %K line crosses over the %D line.
Stochastics Potential Sell Signal
A trader might interpret a sell signal when the Stochastic is above the 80 overbought line and the %K line crosses below the %D line, sell.
An example of possible Stochastic Fast buy and sell signals are illustrated below in the chart of the E-mini S&P 500 Future:
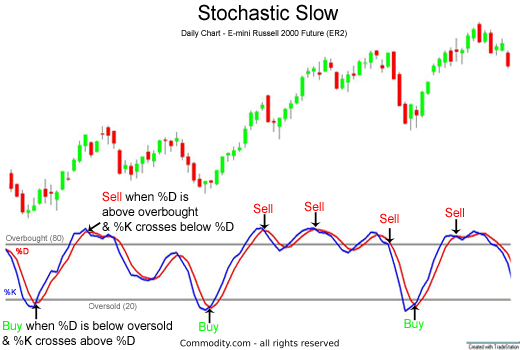
Stochastic Slow is presented below in the chart of the E-mini Russell 2000 Futures contract.
Notice how much smoother the %K and %D lines are and how many fewer false signals were given by the Stochastic Slow than were given by the Stochastic Fast indicator.
The Stochastic technical analysis indicator might be helpful in detecting price divergences and confirming trend. This is discussed in the next section.
Stochastic Price Divergences
Stochastics might be used by a trader to confirm price trend. In the example below of the Nasdaq 100 ETF (QQQQ), the Stochastic indicator spent most of its time in an overbought area.
When Stochastics get stuck in the overbought area, like at the very right of the chart, this might be a sign of a strong bullish run.
Signals to sellshort might be ignored by a trader; however, before the signal not to short was given, many losses may have accrued from failed shorting attempts on the left half of the chart.
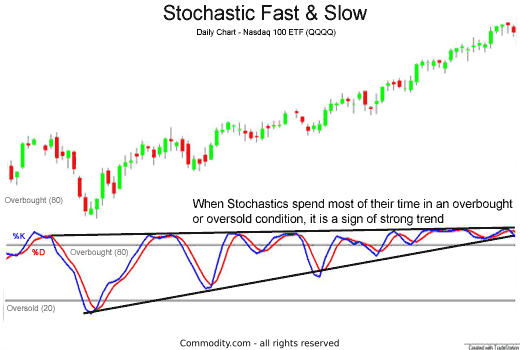
Stochastic pinned above overbought area The chart below of Gold futures illustrates Stochastic divergences and confirmations:
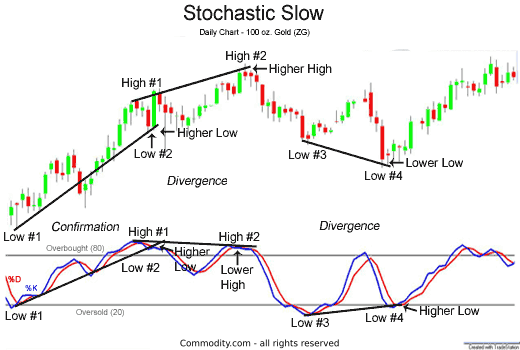
Low #1 to Low #2
The Stochastic Slow confirmed the upward movement of gold futures prices by making a higher low.
High #1 to High #2
Gold futures rallied to make a higher high; however, the Stochastic Slow indicator failed to make a higher high, instead it made a lower high.
This divergence coupled with a trendline break in the price of gold may have acted as a strong warning to futures traders that the recent rally had probably ended and any long futures positions might be exited or at least scaled back.
Low #3 to Low #4
Gold prices continued its downward tumble, making a lower low at Low #4. On the other hand, the Stochastic Slow indicator was signaling a higher low.
This bullish divergence may have warned traders to exit their shortsells, traders may have interpreted that the price of gold had a strong potential of bottoming.
Read more at: https://commodity.com/technical-analysis/stochastics/