Fibonacci retracements berfungsi dengan sangat baik, tetapi hanya jika digambarkan dengan betul. Terdapat banyak cara untuk menariknya dan saya dengan yakin dapat memberitahu anda bahawa sebahagian besar perkara yang anda dapati dalam talian adalah salah, sayangnya. Namun, hari ini, saya berharap dapat mengajar anda cara menggambarkan Fibonacci Retracement dengan betul untuk mencari tahap utama untuk dibeli dan dijual. Ini adalah langkah pertama untuk benar-benar membuka kunci perdagangan yang menguntungkan dalam Forex – percayalah.
Fibonacci retracements work really well, but only if they are drawn properly. There are many ways to draw them and I can confidently tell you that the majority of what you find online is wrong, sadly. Today, however, I hope to teach you how to draw a Fibonacci Retracement correctly in order to find key levels to buy and sell from. This is the first step to really unlocking the key to profitable trading in Forex – trust me.
Sekarang, trik untuk mengetahui cara menggambar Fibonacci Retracements dengan betul datang dari mengetahui bahawa secara semula jadi, mereka berasal dari teori kekacauan dan mempunyai kaitan rapat dengan Elliott Wave and Harmonics. Kami akan membiarkan cacing yang tidak dibuka ketika saya meneliti cara yang betul untuk melihat titik swing tinggi dan swing yang rendah dari carta di mana anda akan menarik Fibonacci Retracements anda.
Now, the trick to knowing how to draw Fibonacci Retracements correctly comes from knowing that inherently, they come from chaos theory and have close links to Elliott Wave and Harmonics. We will leave that can of worms unopened as I drill down into the correct ways to look at the swing high and swing low points of the chart where you will be drawing your Fibonacci Retracements from.
Can Fibonacci Retracement work in both choppy markets and trending markets?
Jawapan ringkas untuk ini adalah: Ya. Fibonacci retracements berfungsi dengan baik di pasar berombak (terikat jarak) dan pasaran tren. Namun, salah satu perkara terpenting yang perlu anda perhatikan adalah struktur dan pergerakannya harus jelas. Apa yang saya maksudkan dengan itu? Lihat gambar di bawah.
The short answer to this is: Yes. Fibonacci retracements work well in both choppy (range bound) markets and trending markets. However, one of the most important things you need to take note of is that the structure and the movements have to be clear. What do I mean by that? Take a look at the pictures below.
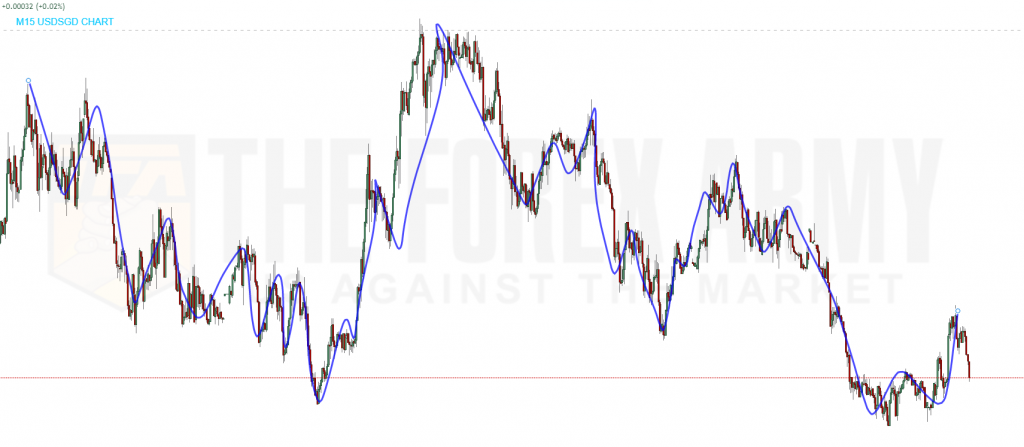
Unclear market structure:
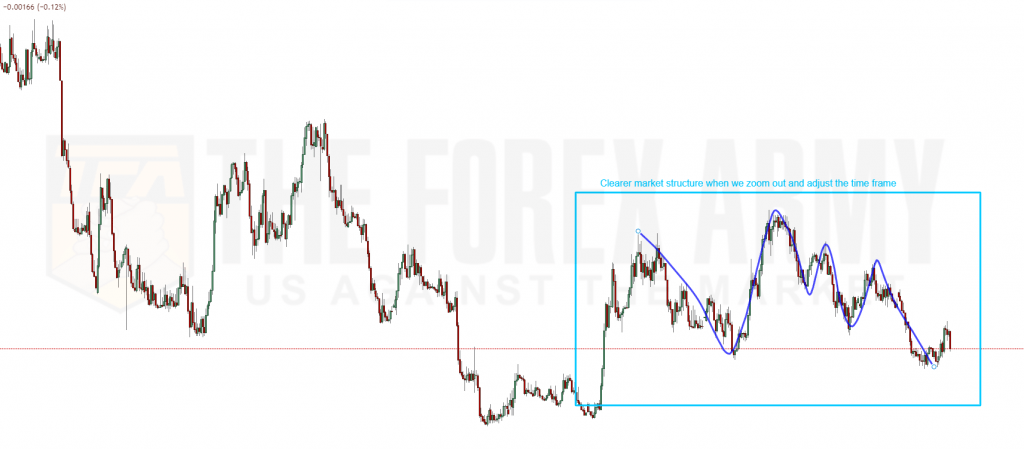
Contoh struktur carta yang kelihatan sangat bagus adalah contoh di bawah. Anda dapat melihat bahawa anda tahu dengan tepat di mana tinggi swing utama dan swing swing yang sangat penting untuk digunakan semasa melukis Fibonacci retracements (dan sambungan).
An example of a chart structure that looks really good is the one below. You can see that you know exactly where are the major swing highs and major swing lows which are crucially important to use when drawing Fibonacci retracements (and extensions).
Clear market structure:
Oleh itu, perkara pertama yang perlu diketahui adalah bahawa sementara Fibonacci Retracements dapat digunakan di kedua-dua pasaran yang berombak dan tren, salah satu perkara penting yang perlu diperhatikan adalah struktur pasaran yang jelas.
So the first thing to know is that while Fibonacci Retracements can be used in both choppy and trending markets, one of the key things to look out for is a clear market structure.
Menyelaraskan kerangka masa untuk struktur pasaran yang lebih jelas
Adjusting time frames for clearer market structure
Satu perkara penting yang dapat kita lakukan untuk mencari struktur pasaran yang lebih jelas untuk melakukan analisis Fibonacci adalah menyesuaikan kerangka masa supaya struktur pasaran lebih jelas. Apa yang kelihatan tidak kemas pada carta M30 mungkin kelihatan sangat jelas pada carta H4.
One important thing we can do to find clearer market structures to do our Fibonacci analysis is to adjust the time frames so that the market structure is clearer. What might look messy on an M30 chart might look very clear on an H4 chart.
Sekiranya terdapat terlalu banyak kekacauan dalam jangka masa yang lebih pendek, itu tidak bermaksud bahawa keseluruhan pasangan mata wang tidak dapat dianalisis pada waktu itu – ini hanya bermaksud bahawa kita perlu mengambil langkah mundur (atau kadang-kadang langkah ke depan ) untuk mendapatkan pandangan yang lebih jelas. Berikut adalah beberapa contohnya.
If there’s too much chaos in the shorter time frames, it does not mean that the entire currency pair is not able to be analyzed at that point of time – it could simply mean that we need to take a step back (or sometimes a step forward) to get a clearer view. Here are some examples of that.
Unclear market structure from M15 view:
Clear market structure with H1 view:
Pada asasnya, semakin jelas ayunan rendah, semakin tinggi ayunan tinggi dan semakin jelas “tren” antara 2 titik ini, semakin tepat Fibonacci Retracement.
At the very basics, the clearer the swing low, the clearer the swing high and the clearer the “trend” between these 2 points, the more accurate a Fibonacci Retracement will be.
Sekarang, apabila saya katakan trending market, ini tidak bermaksud tren super panjang yang berlangsung selama berbulan-bulan dan bertahun-tahun. Semuanya bergantung pada jangka masa carta yang anda lihat. Anda boleh melihat carta M15 dan mengatakan “wow ini mesti menjadi megatrend!” tetapi apabila anda mengambil langkah mundur dan melihatnya, hanya carta yang menunjukkan beberapa hari. Mana-mana jangka masa boleh mempunyai arah aliran, walaupun boleh menjadi jangka pendek atau jangka panjang.
Now, when I say trending market, this doesn’t mean those super long trends that last for months and years. It all depends on the chart time frame you look at. You can be looking at an M15 chart and say “wow this has to be a megatrend!” but when you take a step back and look at it, it is only a chart showing a few days. Any time frame can have a trend, albeit it can be either a short term one or a long term one.
The Fibonacci Retracement Levels That Work (Tried and tested over the years)
Terdapat banyak tahap retracement Fibonacci di luar sana dan bagi saya, orang yang menggabungkan kajian Elliott Wave, Harmonics, Chaos Theory, dan Fibonacci – Saya akan menyempitkannya kepada beberapa tahap retracement Fibonacci yang berfungsi dan meninggalkan yang lain. Ini adalah dari tahun-tahun ujian saya sendiri.
There are many Fibonacci retracement levels out there and for me, a person who combines Elliott Wave, Harmonics, Chaos Theory, and Fibonacci studies – I will narrow it down to a couple of Fibonacci retracement levels that work and leave out the rest. This is from my own years of testing.
Fibonacci Retracement levels between 0% to 100%
- 23.6%
- 38.2%
- 50%
- 61.8%
- 76.4% or 78.6%
- 88%
Ini adalah tahap retracement Fibonacci utama yang berfungsi – selalu ada perdebatan besar mengenai sama ada beberapa tahap berfungsi lebih baik berbanding yang lain tetapi jujur – yang benar – tahap retracement Fibonacci kadang-kadang berfungsi – sepanjang masa. Dan itulah masalahnya.
These are the key Fibonacci retracement levels that work – there is always a huge debate on whether some levels work better vs the others but honestly – the truth is that Fibonacci retracement levels work sometimes – all the time. And that’s the problem.
Caranya adalah dengan mencari beberapa tahap retracement Fibonacci yang berbaris sehingga anda dapat meningkatkan kebarangkalian sekumpulan tahap retracement Fibonacci berfungsi berbanding tahap retracement Fibonacci tunggal yang berfungsi – Inilah definisi pertemuan Fibonacci.
The trick is to find multiple Fibonacci retracement levels lining up together so that you can increase the probability of a bunch of Fibonacci retracement levels working versus a single Fibonacci retracement level working – This is the definition of Fibonacci confluence.
Sekarang, apa yang ingin saya lakukan seterusnya adalah mengajar anda apa yang harus anda perhatikan ketika anda hendak melukis Fibonacci retracement.
Now, what I want to do next is to teach you what to look out for when you are about to draw a Fibonacci retracement.
How to draw a Fibonacci retracement correctly: 4 Essential Steps
Terdapat 4 langkah penting:
There are 4 essential steps:
- Adakah struktur pasaran jelas? (Cari zig zag besar)
- Kenal pasti trend terkini – harga turun atau naik?
- Kenal pasti tahap major swing yang rendah dan high swing yang baru-baru ini
- Sambungkan 2 titik ekstrem – tertinggi ke terendah (aliran menurun), terendah ke tertinggi (aliran menaik)
- Is the market structure clear? (Look for big zig zags)
- Identify the recent trend – prices going down or up?
- Identify recent major swing lows and recent major swing highs
- Connect the 2 extreme points – highest to lowest (downtrend), lowest to highest (uptrend)
Kini anda mempunyai garis retracement Fibonacci yang menunjukkan kepada anda bila anda boleh mengharapkan lonjakan atau reaksi (penurunan).
Now you have Fibonacci retracement lines showing you when you can expect a bounce or a reaction (drop).
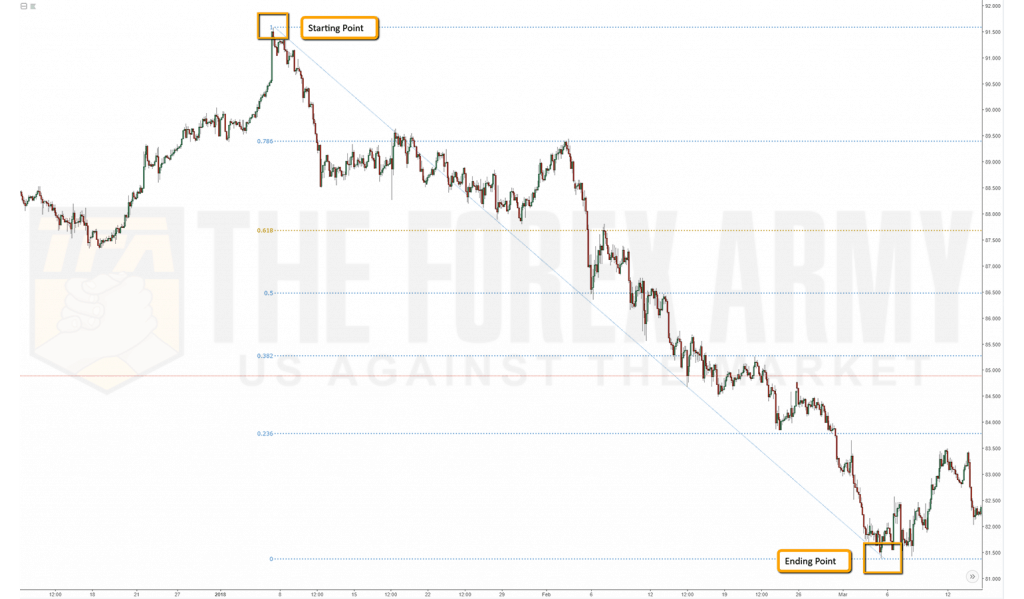
Untuk mencari tahap rintangan utama: Kami bermula pada titik tertinggi dan berakhir pada titik terendah.
To find key resistance levels: We begin at the highest point and end at the lowest point.
Untuk mencari tahap sokongan utama: Kami bermula pada titik terendah dan berakhir pada titik tertinggi.
To find key support levels: We begin at the lowest point and end at the highest point.
PENTING: Sekiranya anda mencari retracement (dari julat 0% hingga 100%), titik akhir anda tidak boleh mempunyai bar di sebelah kanan yang ‘memecahkannya’. Oleh itu, untuk aliran menurun dengan titik akhir yang merupakan titik terendah tren, tidak boleh ada bar yang lebih rendah darinya. Anda dapat memahaminya dengan lebih baik melalui ilustrasi ini:
IMPORTANT: If you are looking for retracements (from 0% to 100% range), your ending points should never have any bars to the right that ‘breaks’ it. So for downtrends with an ending point that is the lowest point of the trend, there should not be any bars that are lower than it. You can better understand it through this illustration :
Ini adalah contoh yang betul untuk mengambil titik permulaan tertinggi ke tahap terendah.
This is a correct example of taking the highest starting point to the lowest.
When does your Fibonacci Retracement become invalid?
Ya, ada kalanya Fibonacci Retracement anda menjadi tidak sah. Salah satu senario yang paling biasa adalah ketika harga naik ke bawah-rendah (dengan asumsi anda melukis retracement Fibonacci dari atas ke bawah seperti dalam gambar di bawah).
Yes, there are times when your Fibonacci Retracement becomes invalid. One of the most common scenarios of this is when price makes a lower-low (assuming you are drawing a Fibonacci retracement from the top to the bottom like in the picture below).
Sekiranya terdapat bar di sebelah kanan yang ‘memecahkan’ titik akhir anda, ia menjadi tidak sah. Inilah contohnya:
If there are bars on the right that ‘break’ your ending point, it becomes invalid. Here’s an example :

Anda dapat melihat bahawa pada dasarnya anda harus mengambil apa yang saya panggil ATL (All Time Low) sebagai titik akhir anda jika anda melukis retracement Fibonacci dari atas ke bawah (dengan itu mencari tahap rintangan).
You can see that you should essentially be taking what I call the ATL (All Time Low) as your ending point if you are drawing a Fibonacci retracement from the top to the bottom (hence finding resistance levels).
Sekarang, terdapat retracement Fibonacci yang negatif (-27%, -61.8%) dan kami akan menyentuh perkara ini kerana pada dasarnya mereka melangkaui titik akhir anda (seperti gambar di atas) YA masih berlaku.
Now, there are Fibonacci retracements that are negative (-27%, -61.8%) and we will touch on these as they basically go beyond your endpoint (like the image above) YET they are still valid.
Fibonacci Retracement Levels (0% to -100%)
Now that we covered the Fibonacci retracement levels from 0% to 100%, we will look at what happens when there are Fibonacci retracements that go beyond the 0% (meaning they are in the negative range). These are actually a form of Fibonacci extension (because it extends beyond the range) but strictly speaking, they use the Fibonacci retracement tool and there is a Fibonacci extension tool which we’ll touch on later (that requires picking 3 points vs 2 points).
- -27.2%
- -61.8%
These are the Fibonacci retracement levels you can consider in the negative retracement zone which are useful. All the rest I found to be quite useless.
Now, this is how a negative Fibonacci retracement looks like (along with the normal range 0-100% and positive range >100%):
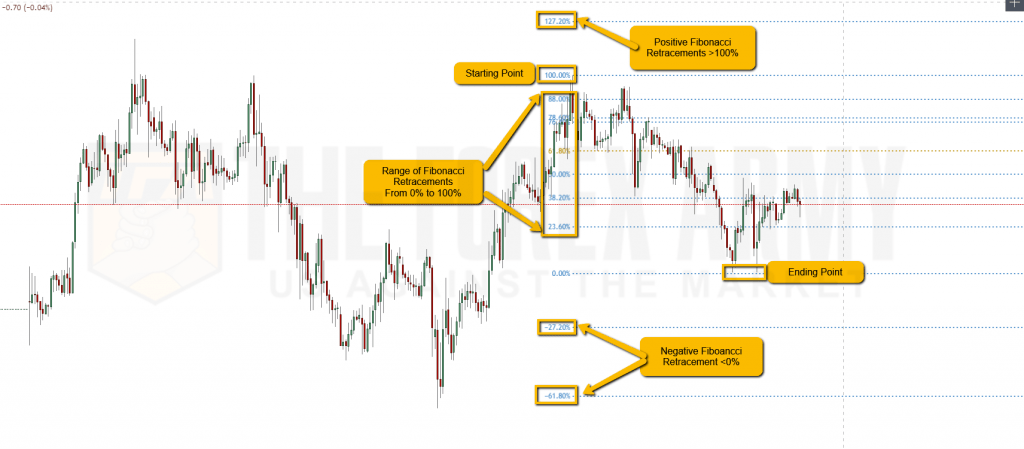
What you immediately notice is that -27.2% and -61.8% is below the ending point so price could technically continue to drop from here and the Fibonacci retracement would still be valid (but the normal range from 0-100% won’t be valid once price goes beyond the ending point).
“Wow, that’s freaking confusing. Can you explain it a bit more?”
Definitely, reading it myself, I still get confused.
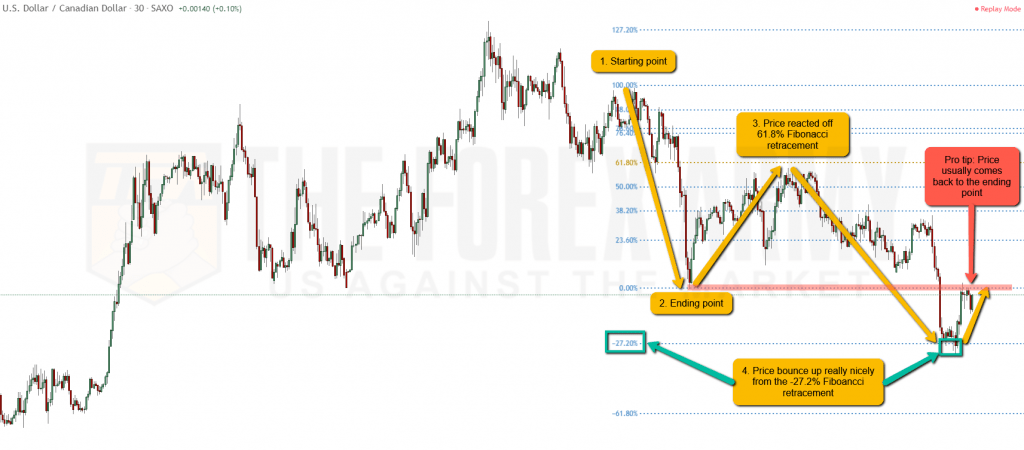
The negative Fibonacci retracements are most useful when price reversed up to about the 61.8% to 78.6% range before continuing to drop. It is NOT effective if it only retraces up to 38.2% (like in the picture above) before it drops beyond the ending point. Let me show you an example of what is a really nice negative Fibonacci retracement.
Part 1: This is how you draw a negative Fibonacci retracement that first reacts off the 61.8% Fibonacci retracement before dropping beyond point 2 (the ending point).

Part 2: You can see how price drops really nicely to the -27.2% Fibonacci retracement level where it bounces up.
Pro tip: Price tends to make a bounce back up to the ending point which is a pullback resistance level (we have an indicator for that).
So the key thing you should take note of is to watch out for the -27.2% Fibonacci retracement and -61.8% Fibonacci retracement. These are particularly useful when you line them up with bigger Fibonacci retracements and even Fibonacci extensions.
Is a Fibonacci Retracement enough to trade profitably?
Short answer: No
The simple fact is: YOU WILL ALWAYS FIND FIBONACCI RETRACEMENT LEVELS.
Imagine using the example above, I told you to sell when price reaches the 23%, then the 38%, then the 50%, followed by the 61.8%, then the 78.6% and on and on and on. What’s going to happen at the end of that? Well, you would have lost a lot of money and probably be spending a bit more money to buy that next plane ticket to find me and kick my teeth in (which I really do not wish to happen).
The trick to trading Fibonacci retracements profitably is in using them in conjunction with other Fibonacci levels. This includes other Fibonacci retracements from a bigger/shorter trend, using Fibonacci extensions (we will cover this), using support and resistance (correctly), and also price action. What this results in is you increase your odds tremendously on getting into profitable trade setups.
Essentially, you are trading something called Fibonacci Confluence which is where the beauty of chaos theory comes in.
How to combine Multiple Fibonacci Retracements to create Fibonacci Confluence?
Fibonacci Confluence is essentially combining multiple Fibonacci levels (can be retracements or extensions) to find clusters where these Fibonacci levels congregate. The area where they congregate would pose a strong level to play a trade from.
Usually, when people trade Fibonacci, they are “contrarian” traders, meaning they are looking to play the bounce/reaction in the other direction. What this means, in other words, is if price is dropping, I am looking for a level to buy from. If price is rising strongly, I am looking for a level to sell from.
Now, when you try to do Fibonacci Confluence, you’ll need to ensure you really know how to draw Fibonacci properly because you are multiplying the chances of you drawing it wrongly (and hence trading wrongly and losing money) as you draw more and more Fibonacci retracements to get that confluence.
My general rule of thumb is that I try to find at least 3 Fibonacci levels to call it a cluster. This can be in the form of:
- 3 x Fibonacci Retracements
- 2 x Fibonacci Retracements + 1 x Fibonacci Extension
- 1 x Fibonacci Retracement + 2 x Fibonacci Extensions
I rarely go for 3 x Fibonacci extensions. Let’s go through some examples of this.
Combining 3 Fibonacci Retracement levels
Combining 3 Fibonacci retracement levels to line up at a certain level can be quite difficult as you will need to master the art of using the Fibonacci retracements > 100% (such as 127.2% and 161.8%) along with the negative Fibonacci retracements (such as -27.2% and -61.8%). Let me show you how I combine 3 Fibonacci retracement levels to identify a good support/resistance level to take a trade from. In the example below, I show you how I combined one big Fibonacci retracement level with 2 other smaller Fibonacci retracement levels (>100%). What we were going for is to play a bounce from a strong area of Fibonacci confluence support.
In the example below, I show you how I combined one big Fibonacci retracement level with 2 other smaller Fibonacci retracement levels (>100%). What we were going for is to play a bounce from a strong area of Fibonacci confluence support.

As you can see in the picture below, price went down to touch this strong area of Fibonacci confluence support and bounced nicely.

Combining 1 x Fibonacci Retracements + 2 x Fibonacci Extension
I find it much easier to find 1 x Fibonacci Retracements and 2 x Fibonacci extension. This also happens to be my favorite style of finding Fibonacci confluence levels. I will teach the topic on identifying Fibonacci extensions in a separate tutorial but the gist of it is that you need to find the starting, middle and ending point (versus just starting and ending for Fibonacci retracement).
In the example below, we can see how we combined 2 Fibonacci extensions (orange and red) along with 1 Fibonacci retracement (teal) to find a strong area of Fibonacci confluence to trade from. What I would do is wait for price to make a push up to that area and when it touches, I would short the market (sell) and play the drop.

Here is what happens when the market touches this strong area of Fibonacci confluence.

Fibonacci Confluence Trading Strategy
So now that you understand (partially or fully) how Fibonacci confluence works, how do you implement that into your trading strategy?
There are a couple of ways to do this. They mainly revolve around improving your entries, your stop loss, and your take profit placements.
Improving your trade management with Fibonacci Confluence
When it comes to trading, it’s absolutely crucial you have good trade management. If you use MT4 (MetaTrader 4), then please go check out the Ultimate MT4 Trade Manager we have – please read through all the different parts of trade management on that page along with stop loss and take profit placement best practices.
There is one thing you need to know about stop loss and take profit placement:
- Stop-loss = Beyond
- Take profit = Before
Stop-loss = beyond means you should always put your stop loss beyond a key Fibonacci confluence area. The reason for this is because more often than not, price is attracted to such strong areas of Fibonacci confluence and if your stop-loss is right before (instead of beyond) it, you will most likely get stopped out before the market reverses. This is one of the reasons most people wonder why they got stopped- out right when the market starts to reverse (and they start complaining about stop hunting).
Take profit = before means that you should always put your take profit target before a key Fibonacci confluence area. The reason for this is because when price reaches the Fibonacci confluence area, there’s a high chance that it will not be able to go beyond it, and instead of reaching your profit target, it reverses back to your entry (or even worse, your stop loss!). This is also one of the reasons why people complain that the market is being manipulated because they miss their TP (take profit) by 1 pip.

So now that you know how you can use Fibonacci confluence areas to improve your stop loss and take profit placement, the next thing you can consider is how you can use Support and Resistance to improve your entries.
Improving your Fibonacci Confluence entries with Support and Resistance
This is one of my favorite trading strategies – combining support and resistance with Fibonacci Confluence. This leads to super high probability setups. I kid you not.
So imagine this: You already found a strong area of Fibonacci Confluence to take a trade from. If you combined it with Support and Resistance, wouldn’t it be much stronger?
Now, if you’re using MT4 (MetaTrader 4), we have developed the best MT4 support and resistance indicator out there. It’s even ranked number 1 on google and youtube. Go and check it out to get a deeper understanding of what proper support and resistance is all about.
Below is an example of how we combined these:
- Pullback resistance (learned in the support and resistance page I mentioned above)
- 2 x Fibonacci retracement
- 1 x Fibonacci extension
What this resulted in was a super-strong confluence area for us to play a short trade from.

What this has resulted in is a high probability reversal zone that has the potential to see price reverse strongly from there. In such situations, I would usually place a short entry there.

As you can see, price reversed right on the dot – that is the power of combining Fibonacci confluence with support and resistance.
https://www.theforexarmy.com/how-to-draw-a-fibonacci-retracement-correctly/
Hi there It’s great that you are getting thoughts from this paragraph as well as from our discussion made here. gracias